
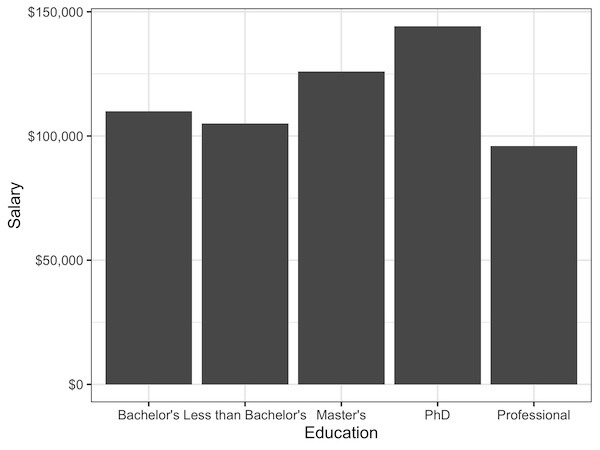
This is a quick guide on how to add dollar signs ($) to your axis labels in ggplot2. We will use the label_dollar() function from the versatile scales package to handle the formatting. This function automatically adds the dollar prefix and inserts commas as thousands separators, making it incredibly simple to display currency on your… Continue reading How to Add Dollar Symbol for Axis Labels with ggplot2?
Tag: ggplot2
How To Make Title Bold in ggplot2?

Want to make your plot titles stand out and look more professional? This comprehensive guide shows you exactly how to make title bold ggplot2 using multiple styling methods, with ready-to-use code examples. 📚 Complete ggplot2 guide — 35+ tutorials with code, themes, labels, and more. Browse hub → Plot titles are crucial for communicating your… Continue reading How To Make Title Bold in ggplot2?
Remove Axis Text & Ticks in ggplot2 (R) — Quick Examples

Sometimes when making a plot in R, you may want a cleaner chart without axis labels or tick marks. In ggplot2, both axis text (the labels) and axis ticks (the small tick marks) can be removed or customized. In this tutorial, you’ll learn how to remove axis text and ticks in ggplot2 for the x-axis… Continue reading Remove Axis Text & Ticks in ggplot2 (R) — Quick Examples
How To Make Lollipop Plot in R with ggplot2?

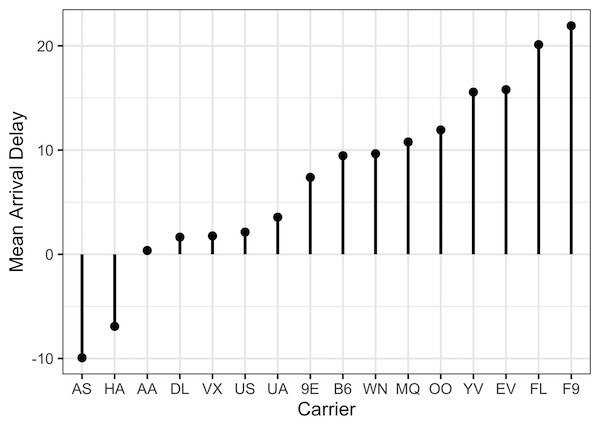
In this post, we will learn how to make lollipop plots in using R. Lollipop plots or lollipop charts kid of related to barplots or scatter plot when one of the variables is categorical variable. We will use NYC flights data from nycflights13 R package. Let us load tidyverse and nycflights13 packages. Data for making… Continue reading How To Make Lollipop Plot in R with ggplot2?
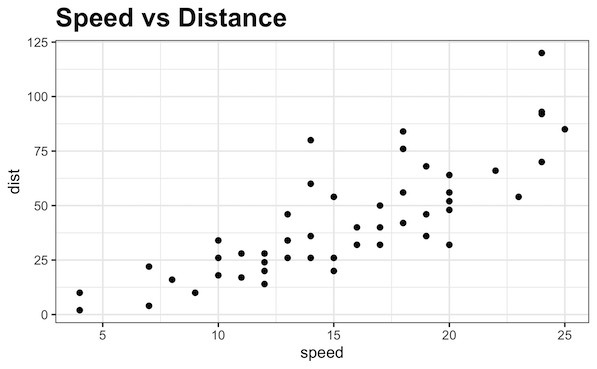
How To Color Scatter Plot by Variable in R with ggplot2?

In this post we will learn how to color scatter plots using another variable in the dataset in R with ggplot2. Scatter plots are extremely useful identify any trend between two quantitative variables. However, often you have additional variable in a data set and you might be interested in understanding its relationship. One way to… Continue reading How To Color Scatter Plot by Variable in R with ggplot2?