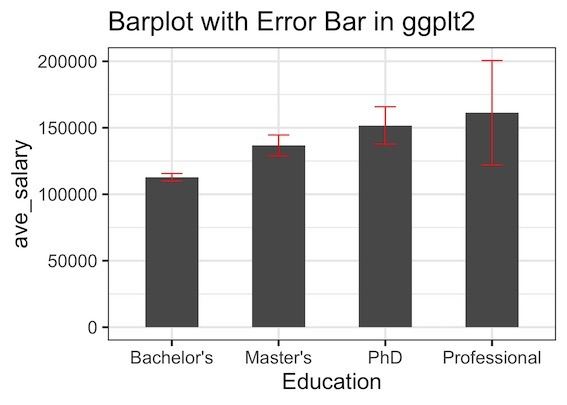
In this post, we will learn how to make a barplot with error bar using ggplot2 in R. Barplot alone is useful to display counts for multiple categories. However, often there may be uncertainty around the count values and we could represent as error bar on the barplot. Let us load tidyverse packages. We will… Continue reading How To Make Barplots with Error bars in ggplot2?
