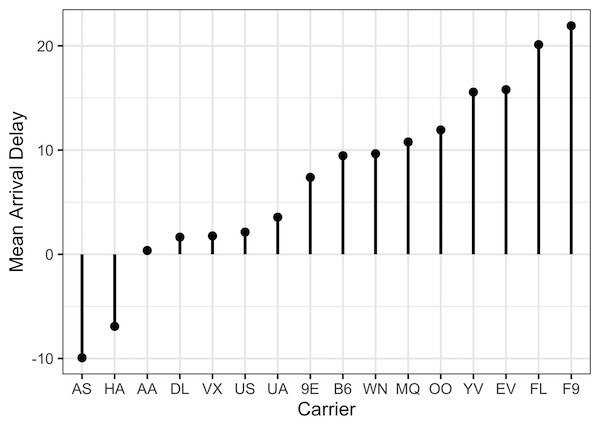
In this post, we will learn how to make lollipop plots in using R. Lollipop plots or lollipop charts kid of related to barplots or scatter plot when one of the variables is categorical variable. We will use NYC flights data from nycflights13 R package. Let us load tidyverse and nycflights13 packages. Data for making… Continue reading How To Make Lollipop Plot in R with ggplot2?
