Sometimes when making a plot in R, you may want a cleaner chart without axis labels or tick marks. In ggplot2, both axis text (the labels) and axis ticks (the small tick marks) can be removed or customized. In this tutorial, you’ll learn how to remove axis text and ticks in ggplot2 for the x-axis and y-axis using theme() and element_blank(). Examples cover heatmaps and quick variations you can reuse in other charts.
👉 Want more? See the complete ggplot2 Tutorial Hub with 35+ recipes.
Load Packages
Let us first load tidyverse, a suite of R packages from RStudio. Let us also load gapminder R package as we will be using gapminder data to make the plot with x-axis ticks and text.
library(tidyverse)
library(gapminder)
theme_set(theme_bw(base_size=16))
Example Data
We’ll use a subset of the gapminder dataset for African countries and convert the year variable into a factor:
df1 <- gapminder |>
  filter(continent %in% c("Africa")) |>
  mutate(year=factor(year))
Example Plot With Axis Text and Ticks
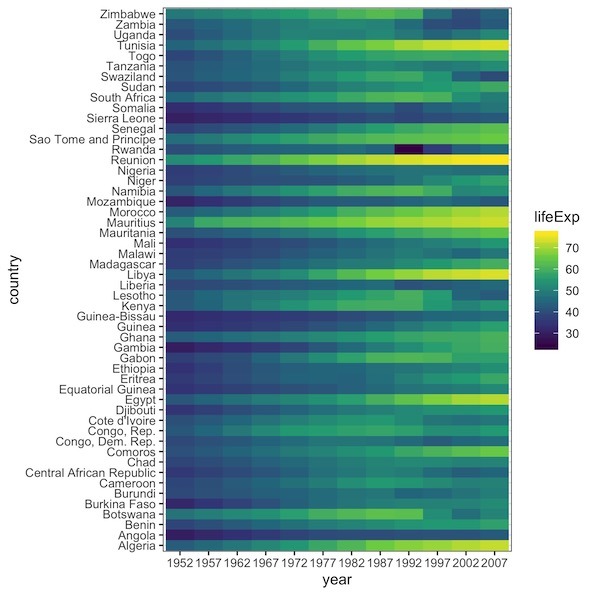
Our example plot in this post is a heatmap of lifeExp over years for african countries. We can make heatmap from tidy data using ggplot2’s geom_tile() function. We have country on y-axis and year on x-axis and the values of heatmap are lifeExp.
df1 |>
  ggplot(aes(y=country, x=year, fill=lifeExp)) +
  geom_tile() +
  scale_fill_viridis_c()
This default heatmap includes axis ticks (small black lines) and axis text labels (years on the x-axis, countries on the y-axis).
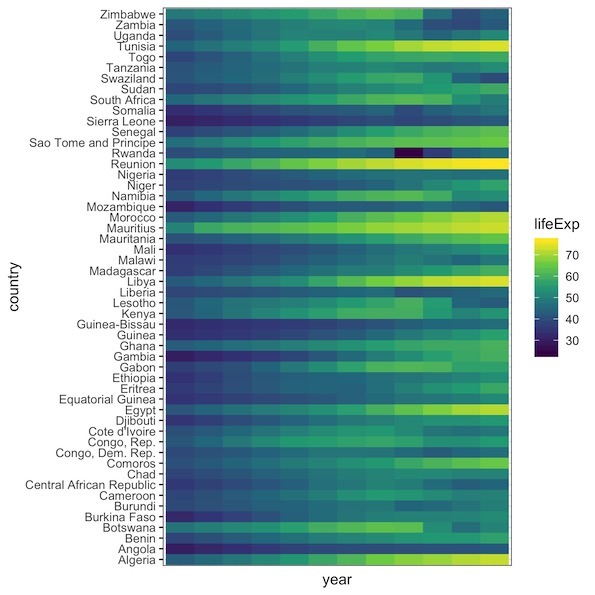
Remove Axis Text and Ticks in ggplot2
The theme() function lets us control axis appearance:
- Remove x-axis ticks: axis.ticks.x = element_blank()
- Remove x-axis text: axis.text.x = element_blank()
We can remove axis ticks and texts using the theme function in ggplot2. The theme() function in ggplot2 is a powerful function that allows users to customize various aspects of ggplot2 theme including the axis ticks and texts.
To remove x-axis ticks we specify the argument axis.ticks.x = element_blank() inside the theme(). And similarly to remove x-axis text, we specify axis.text.x = element_blank().
df1 |>
  ggplot(aes(y=country, x=year, fill=lifeExp)) +
  geom_tile() +
  scale_fill_viridis_c() +
  theme(axis.ticks.x = element_blank(),
        axis.text.x = element_blank())
You can also remove the y-axis text and ticks using axis.ticks.y and axis.text.
More Variations
Remove only axis ticks, keep text
p <- df1 |>
  ggplot(aes(y=country, x=year, fill=lifeExp)) +
  geom_tile() +
  scale_fill_viridis_c()

p + theme(axis.ticks = element_blank())
Remove all axis text and ticks (both x and y)
p +
  labs(title="Remove all axis text and ticks (both x and y axis)") +
  theme(
  axis.text  = element_blank(),
  axis.ticks = element_blank()
)
ggsave("Remove_all_axis_text_and_ticks_both_x_and_y_ggplot.png")


Remove axis titles but keep tick labels
p + theme(axis.title = element_blank())
FAQs
How do I remove only the x-axis labels in ggplot2?
Use axis.text.x = element_blank() inside theme().
What’s the difference between axis.text and axis.title?
axis.text controls tick labels; axis.title controls the axis title (e.g., “Year”). They’re independent.
How do I remove ticks but keep labels?
Use axis.ticks = element_blank() and leave axis.text unchanged.
Related Tutorials
Reference: ggplot2 theme() docs