
One of the first and most critical steps in any data exploration project is understanding the extent of missing data. Missing values, or NAs, can significantly impact your analysis and modeling results. While there are a few quick ways to visualize missing data, one of the most intuitive is the stacked bar plot.
In this step-by-step tutorial, you will learn how to effectively visualize missing data in any R dataframe. We will use the powerful tidyverse and ggplot2 packages to create clear, publication-ready stacked bar plots showing both the counts and proportions of missing data in each column.
Step 1: Setting Up Your R Environment
First, let’s load the tidyverse suit of packages, which includes dplyr for data manipulation and ggplot2 for plotting. We’ll also set a clean default theme for our plots.
library(tidyverse)
theme_set(theme_bw(base_size=16))
Step 2: Loading the Example Dataset
We will use the Hawks dataset from Rdatasets package for this demonstration. The code below reads the dataset directly from a URL and removes an unnecessary index column.
url = "https://vincentarelbundock.github.io/Rdatasets/csv/Stat2Data/Hawks.csv"
hawks <- read_csv(url)  %>%
  select(-X1)
Let’s take a quick glance at the data with head(). We can immediately see some NA values in columns like ReleaseTime and Sex.
hawks %>% head()

## # A tibble: 6 x 19
##   Month   Day  Year CaptureTime ReleaseTime BandNumber Species Age   Sex    Wing
##   <dbl> <dbl> <dbl> <chr>       <time>      <chr>      <chr>   <chr> <chr> <dbl>
## 1     9    19  1992 13:30          NA       877-76317  RT      I     <NA>    385
## 2     9    22  1992 10:30          NA       877-76318  RT      I     <NA>    376
## 3     9    23  1992 12:45          NA       877-76319  RT      I     <NA>    381
## 4     9    23  1992 10:50          NA       745-49508  CH      I     F       265
## 5     9    27  1992 11:15          NA       1253-98801 SS      I     F       205
## 6     9    28  1992 11:25          NA       1207-55910 RT      I     <NA>    412
## # … with 9 more variables: Weight <dbl>, Culmen <dbl>, Hallux <dbl>,
## #   Tail <dbl>, StandardTail <dbl>, Tarsus <dbl>, WingPitFat <dbl>,
## #   KeelFat <dbl>, Crop <dbl>
Now let us make a vertically stacked barplot for the numbers of missing data in each column.
Convert Dataframe to a Boolean Dataframe based on NAs
First, we need to find if each element of every column is missing data or not. We can use is.na() function and summarise_all() function to convert our dataframe into boolean dataframe. Note the use of list to apply a lambda function, here is.na() function to find the missing data.
hawks  |>
  summarise_all(list(~is.na(.)))
Here an element is True when the original dataframe has missing data and an element is False if it is not a missing data.
## # A tibble: 908 x 19
##    Month Day   Year  CaptureTime ReleaseTime BandNumber Species Age   Sex
##    <lgl> <lgl> <lgl> <lgl>       <lgl>       <lgl>      <lgl>   <lgl> <lgl>
##  1 FALSE FALSE FALSE FALSE       TRUE        FALSE      FALSE   FALSE TRUE
##  2 FALSE FALSE FALSE FALSE       TRUE        FALSE      FALSE   FALSE TRUE
##  3 FALSE FALSE FALSE FALSE       TRUE        FALSE      FALSE   FALSE TRUE
##  4 FALSE FALSE FALSE FALSE       TRUE        FALSE      FALSE   FALSE FALSE
##  5 FALSE FALSE FALSE FALSE       TRUE        FALSE      FALSE   FALSE FALSE
Step 3: Reshaping Data for Visualization
Our goal is to create a plot where each variable is on the y-axis and the x-axis shows the count of missing vs. available values. To do this with ggplot2, we first need to transform our data from a wide format (one column per variable) to a long or tidy format.
This process involves three key steps, which we can chain together using the native pipe (|>) operator:
- Check for NAs: Convert the entire dataframe into a boolean dataframe where TRUE means the value is missing.
- Go from Wide to Long: Use pivot_longer() to transform the data, creating one column for variable names and another for their TRUE/FALSE missing status.
- Count the Results: Use count() to get the total number of TRUE and FALSE values for each variable.
hawks  |>
  summarise_all(list(~is.na(.))) |>
  pivot_longer(everything(),
               names_to = "variables", values_to="missing")
## # A tibble: 17,252 x 2
##    variables   missing
##    <chr>       <lgl>
##  1 Month       FALSE
##  2 Day         FALSE
##  3 Year        FALSE
##  4 CaptureTime FALSE
##  5 ReleaseTime TRUE
##  6 BandNumber  FALSE
##  7 Species     FALSE
##  8 Age         FALSE
##  9 Sex         TRUE
## 10 Wing        FALSE
## # … with 17,242 more rows
Note that we can first convert to tidy form and then use is.na() to find if the element is NA or not when our dataframe contains columns/data of the same type.
Count the number of missing values for each column variable
We are ready do compute the number of missing values and non-missing values for each column using count().
hawks  %>%
  summarise_all(list(~is.na(.)))%>%
  pivot_longer(everything(),
               names_to = "variables", values_to="missing") %>%
  count(variables, missing)
## # A tibble: 32 x 3
##    variables   missing     n
##    <chr>       <lgl>   <int>
##  1 Age         FALSE     908
##  2 BandNumber  FALSE     906
##  3 BandNumber  TRUE        2
##  4 CaptureTime FALSE     907
##  5 CaptureTime TRUE        1
##  6 Crop        FALSE     565
##  7 Crop        TRUE      343
##  8 Culmen      FALSE     901
##  9 Culmen      TRUE        7
## 10 Day         FALSE     908
## # … with 22 more rows
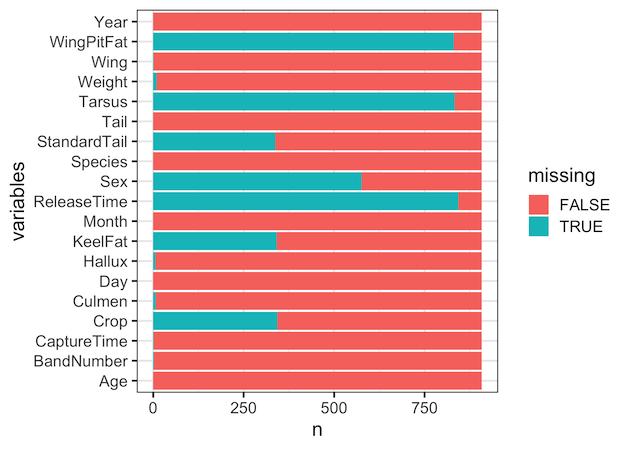
Stacked Barplot with missing value counts
Finally we are ready to make the stacked barplot with the missing value counts for each column in the data.
hawks  |>
  summarise_all(list(~is.na(.))) |>
  pivot_longer(everything(),
               names_to = "variables", values_to="missing") |>
  count(variables, missing) |>
  ggplot(aes(y=variables,x=n,fill=missing))+
  geom_col()
The stacked barplot clearly shows the extent of missing values in each of the columns.
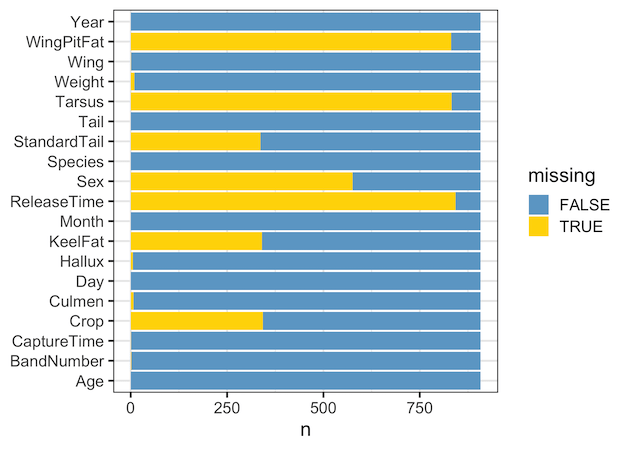
Customizing Stacked Barplot with missing value counts
Let us customize the vertically stacked barplot of missing value counts.
hawks  %>%
  summarise_all(list(~is.na(.)))%>%
  pivot_longer(everything(),
               names_to = "variables", values_to="missing") %>%
  count(variables, missing) %>%
  ggplot(aes(y=variables,x=n,fill=missing))+
  geom_col()+
  scale_fill_manual(values=c("skyblue3","gold"))+
  theme(axis.title.y=element_blank())
Stacked Barplot with missing value proportions
Another way to visualize missing data using barplots is to plot the proportion instead of counts. To make barplots with proportion, we add the argument position=”fill” to geom_col() function.
hawks  %>%
  summarise_all(list(~is.na(.)))%>%
  pivot_longer(everything(),
               names_to = "variables", values_to="missing") %>%
  count(variables, missing) %>%
  ggplot(aes(y=variables,x=n,fill=missing))+
  geom_col(position = "fill")+
  labs(x="Proportion")+
  scale_fill_manual(values=c("skyblue3","gold"))+
  theme(axis.title.y=element_blank())
And we get the stacked barplot with proportion.
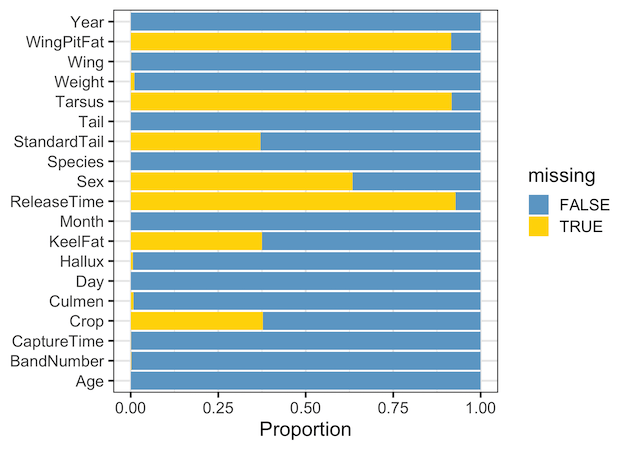
A small note, this example is one of the rare examples where I prefer vertically stacked over barplots with bars side by side.
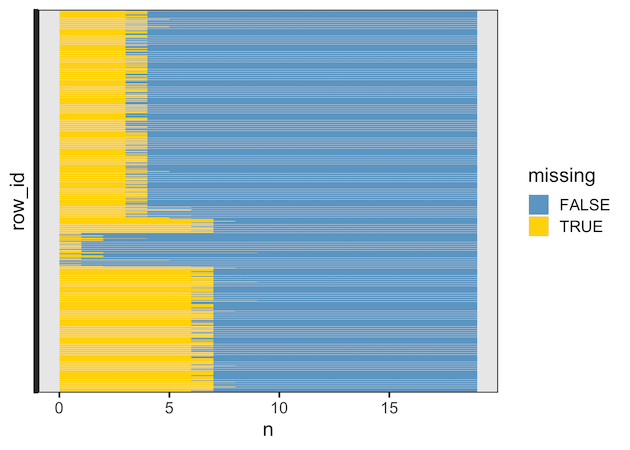
Visualizing missing data counts in rows
So far we saw, the extent of missing data in each column of a dataframe. Another useful data exploration strategy is to quickly visualize the number of missing data in each row.
Here we use the same hawks dataset to compute the number missiung values in each row. The basic idea is the same, but we need to add unique row ID for each row. Here we manually add row number and to compute the number of missing values per row.
hawks  %>%
  summarise_all(list(~is.na(.))) %>%
  mutate(row_id=row_number()) %>%
  pivot_longer(-row_id,
               names_to = "variables", values_to="missing") %>%
  count(row_id, missing) %>%
  ggplot(aes(y=as.factor(row_id),x=n,fill=missing))+
  geom_col()+
  scale_fill_manual(values=c("skyblue3","gold"))+
  theme(axis.text.y=element_blank())+
  labs(y="row_id")
Explore the Complete ggplot2 Guide
35+ tutorials with code: scatterplots, boxplots, themes, annotations, facets, and more—tested and beginner-friendly.
Visit the ggplot2 Hub → No fluff—just code and visuals.


