
In this post we will learn how to add labels to bars on barplot that is stacked side-by-side. We will start with making side-by-side grouped barplot and work our way through adding annotation on top of each bar of the stacked barplot.
Adding annotation to grouped barplot with side-by-side bars is similar to annotating bars in simple barplot. A key challenge you will see from the example is in placing the text or annotation on the grouped bars at correct position.
Let us load tidyverse.
library(tidyverse)
We will use gapminder data to make stacked barplots with annotation on top of the bars.
link2data <- "https://raw.githubusercontent.com/cmdlinetips/data/master/gapminder-FiveYearData.csv"
gapminder <- read_csv(link2data)
## Parsed with column specification:
## cols(
##   country = col_character(),
##   year = col_double(),
##   pop = col_double(),
##   continent = col_character(),
##   lifeExp = col_double(),
##   gdpPercap = col_double()
## )
To make stacked plot we create a simplified data with average lifeExp for two years for the continents. To get that, we will first filter by year and then group by year and continent to compute mean lifeExp.
df <- gapminder %>%
  filter(year %in% c(1952, 2007)) %>%
  mutate(year=as.factor(year)) %>%
  group_by(continent, year) %>%
  summarize(ave_lifeExp=mean(lifeExp))
Now we have the data we need to make the stacked barplot and add annotation.
df %>% head()

## # A tibble: 6 x 3
## # Groups:   continent [3]
##   continent year  ave_lifeExp
##   <chr>     <fct>       <dbl>
## 1 Africa    1952         39.1
## 2 Africa    2007         54.8
## 3 Americas  1952         53.3
## 4 Americas  2007         73.6
## 5 Asia      1952         46.3
## 6 Asia      2007         70.7
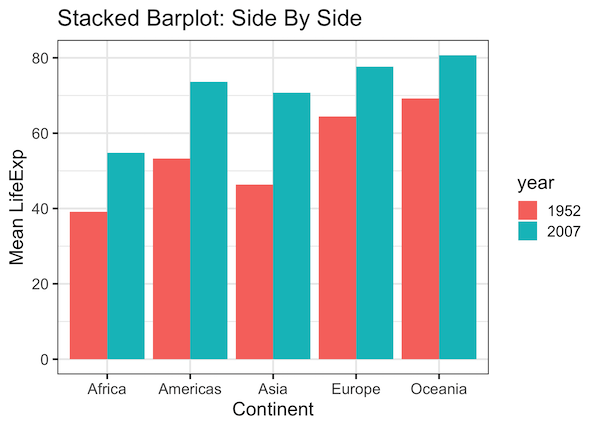
Barplot with bars side-by-side with position=”dodge”
We can make grouped barplot with bars side-by-side using geom_col() function with the argument position=”dodge”. Without this argument, geom_col() will make barplot with bars stacked one on top of the other. Here also fill color by year variable.
df %>%
  ggplot(aes(continent,ave_lifeExp, fill=year))+
  geom_col(position="dodge") +
  labs(title="Stacked Barplot: Side By Side",
        x="Continent", y= "Mean LifeExp")
How to Add Annotation to Grouped Barplot with bars side-by-side?
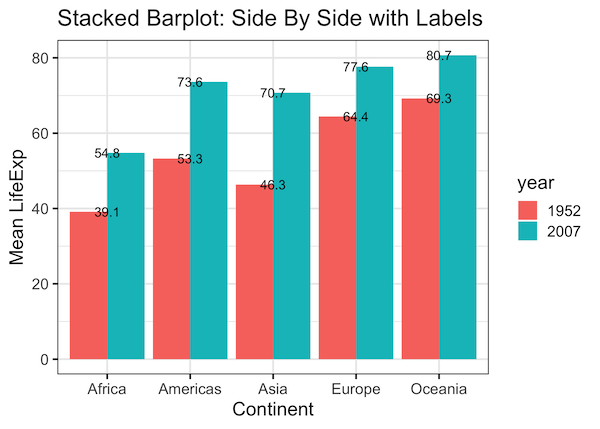
There are many ways to add text annotation to a plot in ggplot2. Let us use a simple approach to add annotation in ggplot2. We use geom_text() with aesthetics label to add text to the plot. We specify that we want to add ave_lifeExp as annotation to the plot.
df %>%
  ggplot(aes(continent,ave_lifeExp, fill=year))+
  geom_col(position="dodge") +
  labs(title="Stacked Barplot: Side By Side with Labels",
        x="Continent", y= "Mean LifeExp")+
  geom_text(aes(label = round(ave_lifeExp, 1)))
Our first effort to add annotation did not really fail, we have avg_lifeExp values on top the bars in barplot. However, the annotations are not aligned well each grouped bar in the barplot.
Customizing Bar Height Annotation to Grouped Barplot with bars side-by-side
Let us try to adjust the position of the annotation using the position argument to geom_text() function. Here we use position_dodge(0.9) for position argument.
df %>%
  ggplot(aes(continent,ave_lifeExp, fill=year),ave_lifeExp)+
  geom_col(position="dodge") +
  coord_flip()+
  labs(title="Stacked Barplot: Side By Side with Labels",
        x="Continent", y= "Mean LifeExp")+
  geom_text(aes(label = round(ave_lifeExp, 1)),
            position = position_dodge(0.9))
Our annotation on top of bars in grouped barplot look much better now. Still, the annotation overlaps the top portion of the barplot.

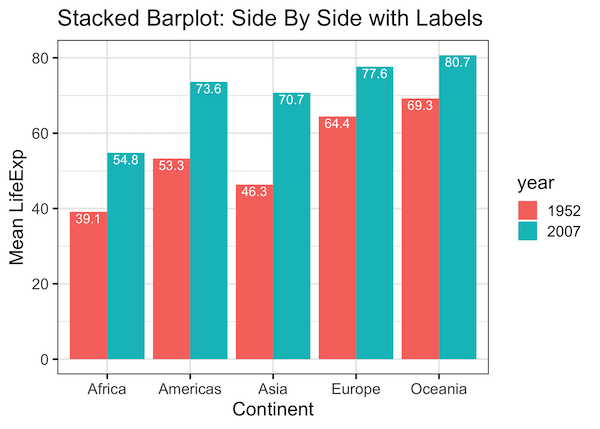
A solution is to place the text annotation within the bars just below where the bar ends. Annotating the text color differently from the bar color will enhance its visibility.
df %>%
  ggplot(aes(continent,ave_lifeExp, fill=year),ave_lifeExp)+
  geom_col(position="dodge") +
  coord_flip()+
  labs(title="Stacked Barplot: Side By Side with Labels",
        x="Continent", y= "Mean LifeExp")+
  geom_text(aes(label = round(ave_lifeExp, 1)),
            position = position_dodge(0.9),
            color="white",vjust = 0.5,hjust = 1)
In this example, the text annotation is in white color made with color argument inside geom_text().
Explore the Complete ggplot2 Guide
35+ tutorials with code: scatterplots, boxplots, themes, annotations, facets, and more—tested and beginner-friendly.
Visit the ggplot2 Hub → No fluff—just code and visuals.


Terrific, what if some bars have 0 as value, and you don’t want a label on them?
(Newbe)
Filtering the data with zero values would help. ggplot2 will not make a plot for that and therefore there will be no annotation.
Here is a sample code and there will be no bar for Africa in year 1952.
df %>%
filter(continent!= “Africa” | year != 1952)%>%
ggplot(aes(continent,ave_lifeExp, fill=year))+
geom_col(position=”dodge”) +
labs(title=”Stacked Barplot: Side By Side with Labels”,
x=”Continent”, y= “Mean LifeExp”)+
geom_text(aes(label = round(ave_lifeExp, 1)),
position = position_dodge(0.9),
color=”white”,vjust = 1.2)