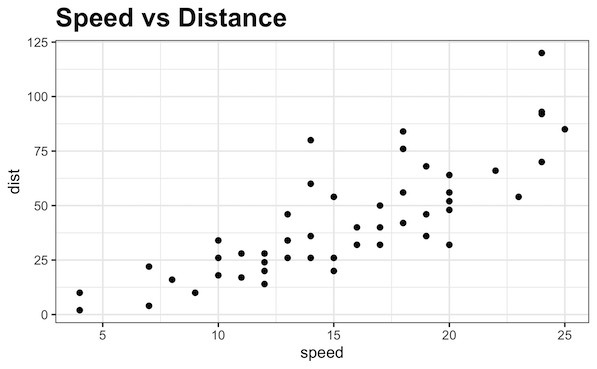
One of the common failures of making a data visualization is wither not having a title for plot or having a title that is not easy to read. Making the title in bold can help making the visualiation better. In this post, we will learn how to make the title of plot made with ggplot bold font.
Let us loadtidyverse, the suite of R packages from RStudio.
library(tidyverse)
theme_set(them_bw())
We will use cars data that inbuilt with R to make a simple scatter plot with a default title size.
head(cars)
##   speed dist
## 1     4    2
## 2     4   10
## 3     7    4
## 4     7   22
## 5     8   16
## 6     9   10
Let us make a scatter plot with speed on x-axis and dist on y-axis using geom_point(). We will also add a title using ggplot function labs().
cars %>%
  ggplot(aes(x=speed,y=dist)) +
  geom_point()+
  labs(title="Speed vs Distance")
By default the title made by ggplot is not in bond font.
We can make the title of a plot bold in ggplot2 using theme() function. theme function can handle many aspects of the ggplot2 theme including title. To change the title font to bold, we can use plot.title argument and specify element_text(face=”bold”) as shown below.
cars %>%
  ggplot(aes(x=speed,y=dist)) +
  geom_point()+
  labs(title="Speed vs Distance")+
  theme(plot.title = element_text(face="bold"))
And now our plot’s title is bold as we wanted.
We can also increase the size of the text using size argument inside element_text() in addition to the face=bold argument.
cars %>%
  ggplot(aes(x=speed,y=dist)) +
  geom_point()+
  labs(title="Speed vs Distance")+
  theme(plot.title = element_text(face="bold", size=18))
Now we have the title with larger fontsize and in bold.
