In this post we will learn how to color scatter plots using another variable in the dataset in R with ggplot2. Scatter plots are extremely useful identify any trend between two quantitative variables. However, often you have additional variable in a data set and you might be interested in understanding its relationship. One way to do that is to color scatter plot by the third variable in the dataset.
Let us load the necessary R packages for making scatter plots in R. We will use NYC flight datasets to make scatter plots and color the scatter plot by a variable. NYC flight data is available from nycflights13 R package made by Hadley Wickham. So we load tidyverse and nycflights13 packages.
library(tidyverse)
library(nycflights13)
theme_set(theme_bw(base_size=16))
In nycflights13 dataset’s flights data has a lot of basic information for the flights out of 3 NYC area airports for the year 2013.
flights %>% colnames()

 [1] "year"           "month"          "day"            "dep_time"
 [5] "sched_dep_time" "dep_delay"      "arr_time"       "sched_arr_time"
 [9] "arr_delay"      "carrier"        "flight"         "tailnum"
[13] "origin"         "dest"           "air_time"       "distance"
[17] "hour"           "minute"         "time_hour"
Let us subset the flights data to contain 2000 randomly selected rows from the data. Here we select departure and arrival delay and origin airport for making scatter plot and color it. We also drop any rows with missing values using drop_na() function.
flights_2k <- flights %>%
  select(dep_delay, arr_delay, origin)%>%
  sample_n(2000) %>%
  drop_na()
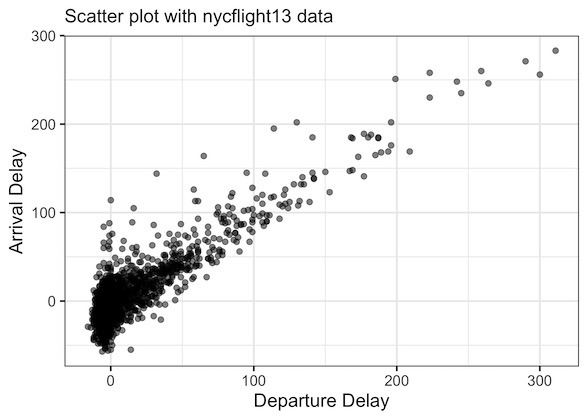
We will start with making a simple scatter plot in R using ggplot2. We can make scteer plot in R with ggplot2 using geom_point() function. We use departure delay and arrival delay from flights data as x and y-axis for the plot.
flights_2k %>%
  ggplot(aes(dep_delay,arr_delay)) +
  geom_point(alpha=0.5, size=2) +
  labs(y="Arrival Delay", x="Departure Delay", subtitle="Scatter plot with nycflight13 data")
In this scatter plot, we have also specified transparency with alpha argument and size of the points with size argument.

How to Color Scatter Plot in R by a Variable with ggplot2
There are at least two ways we can color scatter plots by a variable in R with ggplot2.
Color Scatter Plot using color with global aes()
One of the ways to add color to scatter plot by a variable is to use color argument inside global aes() function with the variable we want to color with. In this scatter plot we color the points by the origin airport using color=origin.
flights_2k %>%
  ggplot(aes(dep_delay,arr_delay, color=origin)) +
  geom_point(alpha=0.5, size=2) +
  labs(y="Arrival Delay", x="Departure Delay", subtitle="Scatter plot with nycflight13 data")
The color argument has added colors to scatterplot with default colors by ggplot2. ggplot2 also adds a legend explaining the color to the value of the variable we used to color.

Color Scatter Plot using color within aes() inside geom_point()
Another way to color scatter plot in R with ggplot2 is to use color argument with variable inside the aesthetics function aes() inside geom_point() as shown below. The code chuck below will generate the same scatter plot as the one above.
flights_2k %>%
  ggplot(aes(dep_delay,arr_delay)) +
  geom_point(alpha=0.5, size=2, aes(color=origin)) +
  labs(y="Arrival Delay", x="Departure Delay", subtitle="Color Scatter plot By a Variable\nwith aes() inside geom_point()")
A commmon mistake one would make while coloring scatter plot in R with ggplot2 is to use fill as argument with the variable. The code below shows the common way to try fill to color the points on scatter plot.
flights_2k %>%
  ggplot(aes(dep_delay,arr_delay, fill=origin)) +
  geom_point(alpha=0.5, size=2) +
  labs(y="Arrival Delay", x="Departure Delay", subtitle="Color Scatter plot By a Variable with fill")
However, the above code chunck would not color the scatter plot at all. The reason is that the default point or shape that ggplot2 uses to make scatter plot can not take fill. We can change the default shape to something else and use fill to color scatter plot by variable.
For example, here is how to color scatter plots in R with ggplot using fill argument. Here we use fill=origin and change the default shape with shape=21.
flights_2k %>%
  ggplot(aes(dep_delay,arr_delay, fill=origin)) +
  geom_point(alpha=0.5, size=2, shape=21) +
  labs(y="Arrival Delay", x="Departure Delay", subtitle="Scatter plot with nycflight13 data")
We can see that we have cicles filled by color with black outline on the scatter plot made in R.