
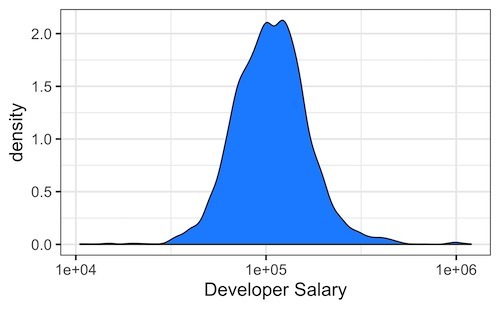
In this tutorial, we will see how to make density plots with ggplot2 in R. We will start with an example of making a basic density plot with ggplot2 and see multiple examples of making the density plots better. Let us load tidyverse, a suite R packages from RStudio and also set the default theme… Continue reading How To Make Density Plots with ggplot2 in R?
Category: R
How to Combine Multiple ggplot2 Plots? Use Patchwork

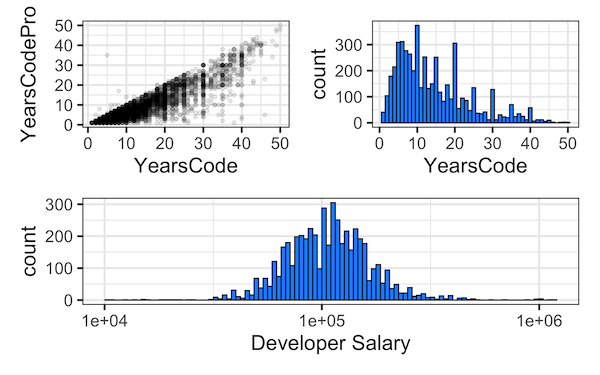
When you have made great data visualizations often you have to combine the plots into a single figure. Thomas Lin Pedersen from RStudio has made a fantastic R package to combine the plots. In his words, The goal of patchwork is to make it ridiculously simple to combine separate ggplots into the same graphic. As… Continue reading How to Combine Multiple ggplot2 Plots? Use Patchwork
5 tips to make better histograms with ggplot2 in R

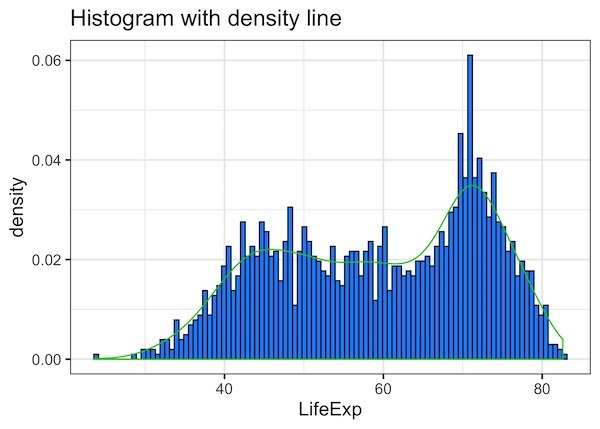
Histograms are of great use to visualize a uni-variate distribution. As ggplot2 defines, histograms “Visualise the distribution of a single continuous variable by dividing the x axis into bins and counting the number of observations in each bin.” ggplot2’s geom_histogram() function displays the counts as bars and it also makes it easy to customize histograms… Continue reading 5 tips to make better histograms with ggplot2 in R
Coloring Barplots with ggplot2 in R


In this tutorial, we will see examples of making barplots and coloring the barplots in a few simple ways. We will see how to color barplots manually by specifying a color of interest and how to color a barplot by another variable in the dataset. Let us load tidyverse suite of packages and set the… Continue reading Coloring Barplots with ggplot2 in R
How to Make Horizontal Stacked Barplots with ggplot2 in R?
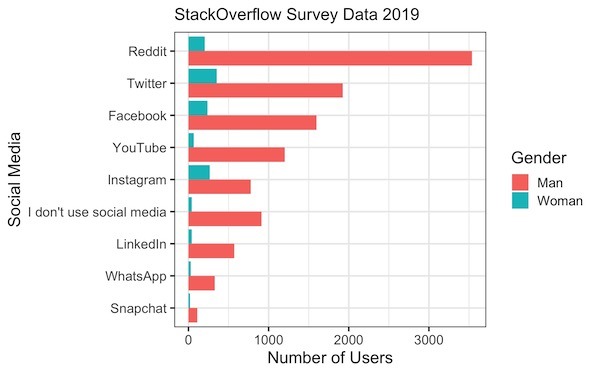
Stacked barcharts are a variant of barplots, when you have data from multiple groups. In this tutorial, we will see two examples of making stacked barplots using ggplt2 in R. First we will see how to make stacked barplot of two groups with one on top of the other. In the second example we will… Continue reading How to Make Horizontal Stacked Barplots with ggplot2 in R?