
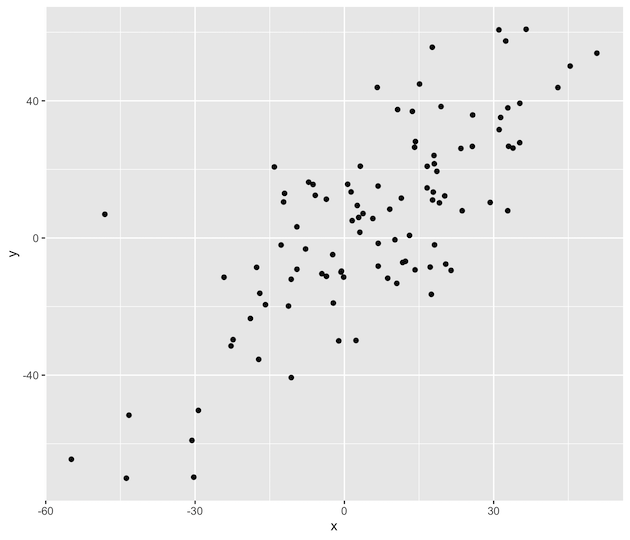
Scatter plot is a great data visualization tool to visualize relationship between two quantitative variables. We will see an example to make a simple scatter plot in R with ggplot2. Let us first load the ggplot2 package. Let us create a data set and store it in a data frame. Let us use the above… Continue reading Simple Scatter Plot in R with ggplot2