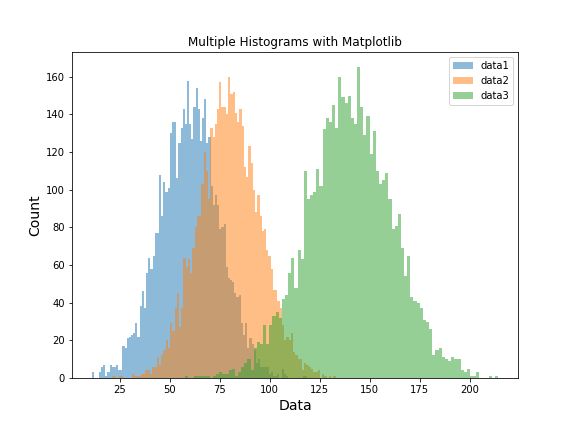
In this post we will see example of plotting multiple histograms on the same plot using Matplotlib in Python. Let us first load Matplotlib and numpy to make overlapping histograms with Matplotlib in Python. We will simulate data using NumPy’s random module. First we create two numerical variables from gaussian normal distribution with specified mean… Continue reading Overlapping Histograms with Matplotlib in Python
Tag: Histogram
How To Make Histograms with Matplotlib in Python?
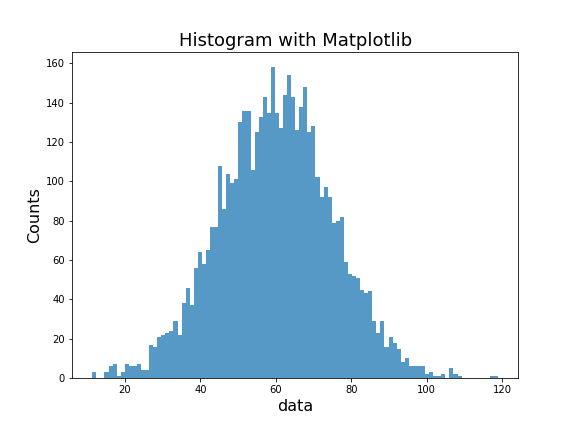
In this post, we will see an example of how to make histogram with Matplotlib library in Python. Matplotlib’s pyplot module is designed to make a number of types of plots with Matplotlib. We will use pyplot module’s function hist() to make histograms with matplotlib. Let us load Matplotlib.pyplot and Numpy library. We will generate… Continue reading How To Make Histograms with Matplotlib in Python?
5 tips to make better histograms with ggplot2 in R
Histograms are of great use to visualize a uni-variate distribution. As ggplot2 defines, histograms “Visualise the distribution of a single continuous variable by dividing the x axis into bins and counting the number of observations in each bin.” ggplot2’s geom_histogram() function displays the counts as bars and it also makes it easy to customize histograms… Continue reading 5 tips to make better histograms with ggplot2 in R
How to Add Outline/Edge Color to Histogram in Seaborn?
In this tutorial, we will see an example of adding edge color/edge line to histograms made with Seaborn. Let us load the packages needed to make histogram with outlines using Seaborn. We will use Seattle weather data from vega_datasets to make histograms. Let us first make a histogram with Seaborn’s distplot. By default, distplot() fills… Continue reading How to Add Outline/Edge Color to Histogram in Seaborn?
Histograms with Seaborn in Python
Histograms are a type of barchart, that visualizes how a quantitative variable is distributed. With the right histogram we can quickly learn about the variable. For example, we can learn what is the most common value, what is the minimum and maximum and what is the spread of the variable by looking at the histogram.… Continue reading Histograms with Seaborn in Python

