

In this tutorial, we will learn how to make multiple density plots in R using ggplot2. Making multiple density plot is useful, when you have quantitative variable and a categorical variable with multiple levels. First, we will start with making multiple overlapping density plots and then see 4 ways to customize the density plot and… Continue reading Multiple Density Plots and Coloring by Variable with ggplot2
Category: Density plot ggplot2
How To Add Mean Line or Vertical Line to Density Plot with ggplot2?


Adding a vertical line on mean or median value of a distribution to its density plot can make understanding the plot easier. In this post, we will first see a simple example of adding mean line to a density plot using ggplot2 in R. And then we will also see an example of adding a… Continue reading How To Add Mean Line or Vertical Line to Density Plot with ggplot2?
How To Make Density Plots with ggplot2 in R?

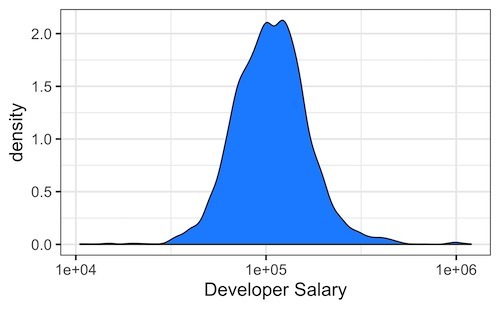
In this tutorial, we will see how to make density plots with ggplot2 in R. We will start with an example of making a basic density plot with ggplot2 and see multiple examples of making the density plots better. Let us load tidyverse, a suite R packages from RStudio and also set the default theme… Continue reading How To Make Density Plots with ggplot2 in R?