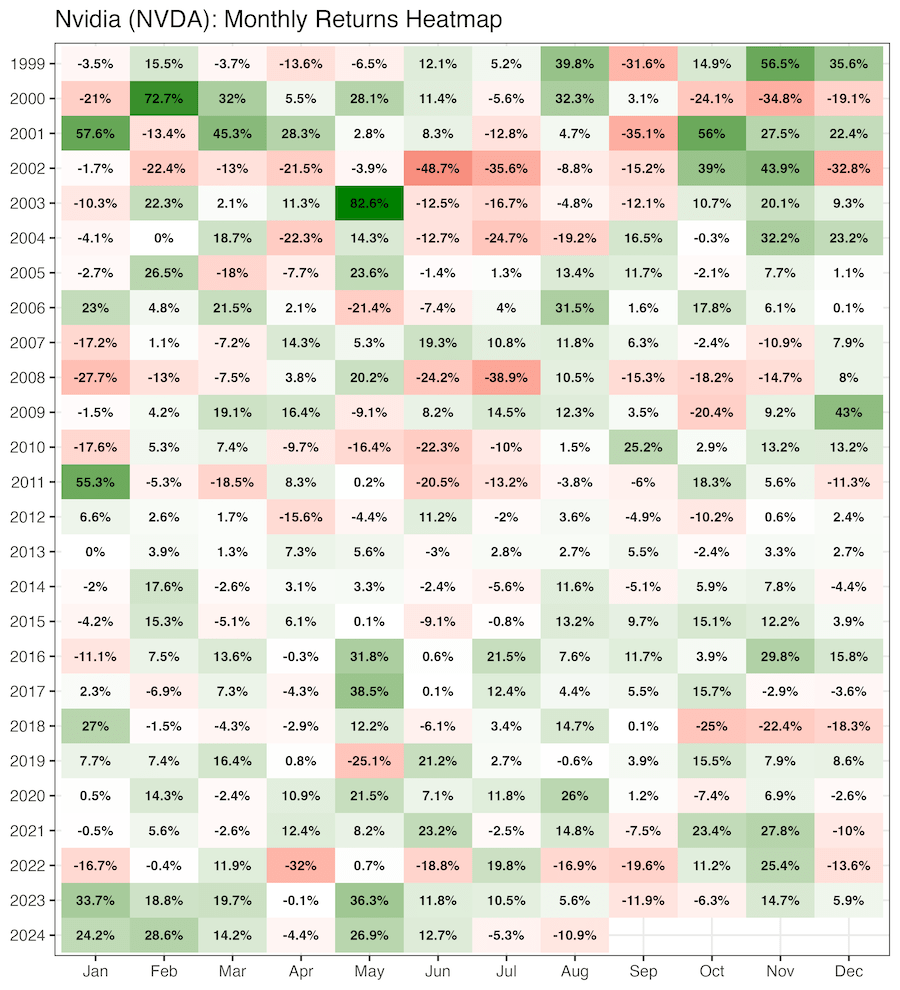
In this post, we will see how can we add text annotation to heatmaps made with ggplot2. In ggplot2, we can make simple heatmaps using ggplot2’s geom_raster() and geom_tile(). In this post, we will use geom_text() to add text annotation, i.e. numerical values in the heatmap. We will also see multiple examples of adding color… Continue reading How to add text annotation to heatmap with ggplot2
How to directly add labels on a plot with ggrepel
In this tutorial, we will learn how to add legends to a plot made with ggplot2 directly on the plot, so that it is much easier to understand the plot. When you make a plot with ggplot, adding legends to explain the plot is of great help to understand a plot. By default, ggplot2 adds… Continue reading How to directly add labels on a plot with ggrepel
3 Different ways to make bar plots with ggplot2
In this post, we will see three different ways to make a barplot with count on y-axis in ggplot2. We will show how to make bar plot using geom_bar(), stat_count(), and geom_col() functions available in ggplot2 Bar plot with geom_bar() Bar plot with stat_count() Bar plot with geom_col()
How to specify the order of panes in facet_wrap
In this tutorial, we will learn how to change the order of panes in a plot made with facet_wrap() or facet_grid(). We will use forcats package’s function fct_relevel() to specify the order we want while plotting. Let us make a scatterplot with facets using facet_wrap() function in ggplot2. Change order of plots in facet_wrap() with… Continue reading How to specify the order of panes in facet_wrap
How to Format Date in title text in ggplot2
In this tutorial, we will learn how to format date variables in the title text of a plot made with ggplot2. Sometimes one might want to write date in the title text. It is better to use the date as variable and format the way want, either full month or short month or full/partial days.… Continue reading How to Format Date in title text in ggplot2
