In this tutorial, we will learn how to format date variables in the title text of a plot made with ggplot2. Sometimes one might want to write date in the title text. It is better to use the date as variable and format the way want, either full month or short month or full/partial days. We will use format() function available in base R to format a date variable to our liking in the title text.
Let us load the packages needed.
library(tidyquant)
library(tidyverse)
theme_set(theme_bw(16))
We will use stock market data to make barplots to show how to format date variable in title text. Let us download Google and Microsoft’s stock price data over time (from 2021 to now).
stock_tickers = c("GOOG","MSFT")
start_date <- as.Date("2021-01-01")
end_date <- Sys.Date()
stock_df <- stock_tickers |>
  tq_get(from = start_date,
         to = end_date)
stock_df %>% head()

# A tibble: 6 × 8
  symbol date        open  high   low close   volume adjusted
  <chr>  <date>     <dbl> <dbl> <dbl> <dbl>    <dbl>    <dbl>
1 GOOG   2021-01-04  87.9  88.0  85.4  86.4 38038000     86.3
2 GOOG   2021-01-05  86.2  87.4  85.9  87.0 22906000     86.9
3 GOOG   2021-01-06  85.1  87.4  84.9  86.8 52042000     86.7
4 GOOG   2021-01-07  87.0  89.4  86.9  89.4 45300000     89.3
5 GOOG   2021-01-08  89.4  90.5  88.7  90.4 41012000     90.3
6 GOOG   2021-01-11  89.3  89.7  88.0  88.3 24194000     88.2
We will make a barplot of the yearly returns, so let us compute yearly returns for these two companies using tidyquant’s tq_transmute() function.
yearly_return <- stock_df |>
  group_by(symbol) |>
  tq_transmute(select     = adjusted,
               mutate_fun = periodReturn,
               period     = "yearly") |>
  ungroup()
yearly_return %>% head()

# A tibble: 6 × 3
  symbol date       yearly.returns
  <chr>  <date>              <dbl>
1 GOOG   2021-12-31          0.674
2 GOOG   2022-12-30         -0.387
3 GOOG   2023-12-29          0.588
4 GOOG   2024-07-05          0.364
5 MSFT   2021-12-31          0.558
6 MSFT   2022-12-30         -0.280
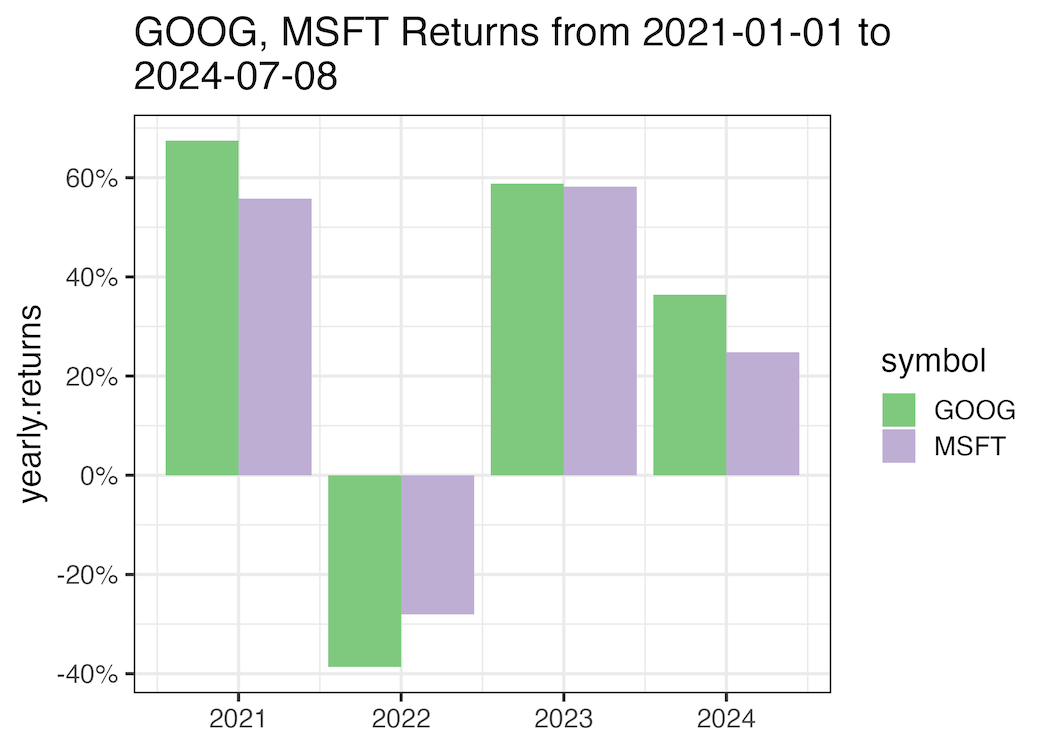
We have the returns data ready to make a barplot with year on x-axis and yearly returns on y-axis. We briefly specify the time period for these company’s returns in the title text.
yearly_return %>%
  ggplot(aes(x=year(date), y=yearly.returns, fill=symbol))+
  geom_col(position="dodge")+
  scale_y_continuous(breaks=scales::breaks_pretty(6),
                     labels = scales::percent_format())+
  scale_fill_brewer(palette="Accent")+
  labs(x=NULL,
       title=paste0("GOOG, MSFT Returns from ",start_date, " to\n", end_date))
ggsave("How_to_format_date_variable_in_ggplot2_title.png")
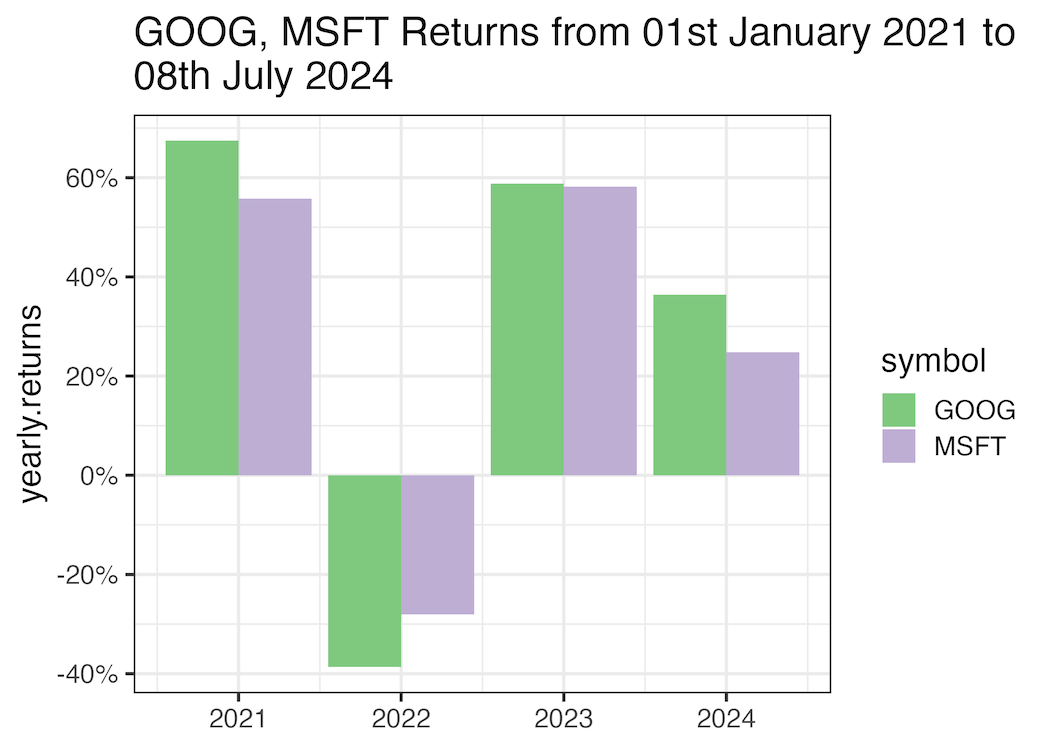
Let us format the date variable in the title, so that it is more readable. We use format() function on the date variable with the specific format we want. In the example below we want to have the month name and year in full.

yearly_return %>%
  ggplot(aes(x=year(date), y=yearly.returns, fill=symbol))+
  geom_col(position="dodge")+
  scale_y_continuous(breaks=scales::breaks_pretty(6),
                     labels = scales::percent_format())+
  scale_fill_brewer(palette="Accent")+
  labs(x=NULL,
       title=paste0("GOOG, MSFT Returns from ", format(as.Date(start_date), "%dst %B %Y"),
                    " to\n", format(end_date, "%dth %B %Y")))
ggsave("format_date_variable_in_title_text_ggplot2.png")
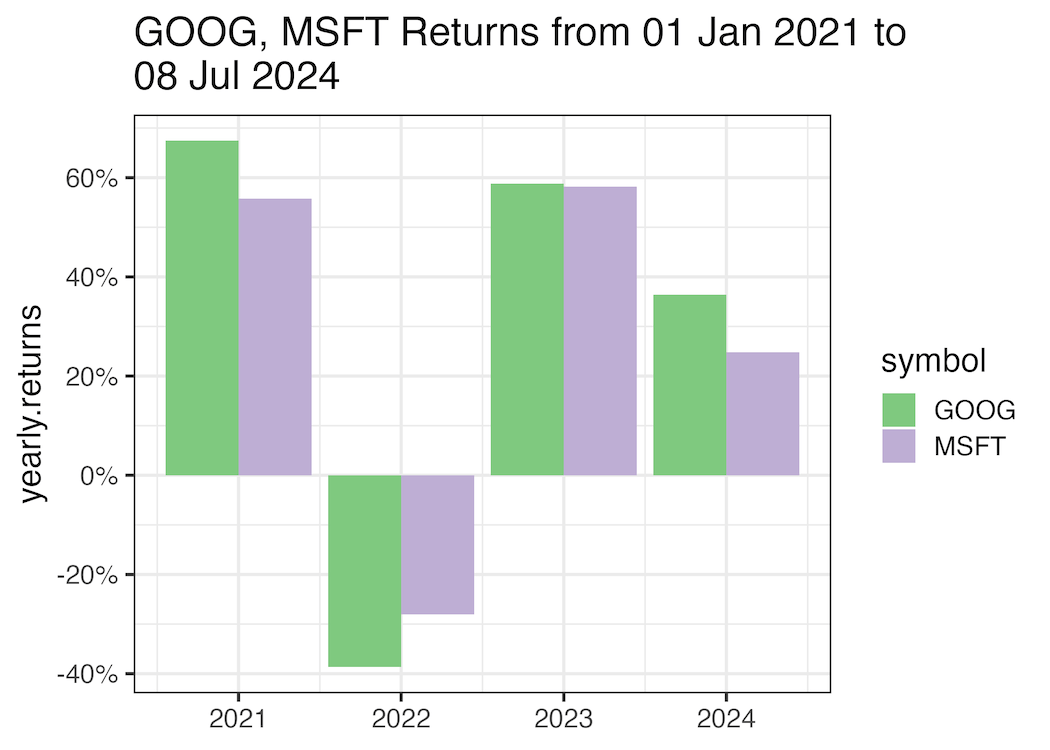
Here is another example of formatting date in the title text with format() function. In the example below we use short month name instead of full month name.
yearly_return %>%
  ggplot(aes(x=year(date), y=yearly.returns, fill=symbol))+
  geom_col(position="dodge")+
  scale_y_continuous(breaks=scales::breaks_pretty(6),
                     labels = scales::percent_format())+
  scale_fill_brewer(palette="Accent")+
  labs(x=NULL,
       title=paste0("GOOG, MSFT Returns from ", format(as.Date(start_date), "%d %b %Y"),
                    " to\n", format(end_date, "%d %b %Y")))
ggsave("format_date_variable_in_title_text_ggplot2_example2.png")
Explore the Complete ggplot2 Guide
35+ tutorials with code: scatterplots, boxplots, themes, annotations, facets, and more—tested and beginner-friendly.
Visit the ggplot2 Hub → No fluff—just code and visuals.


