
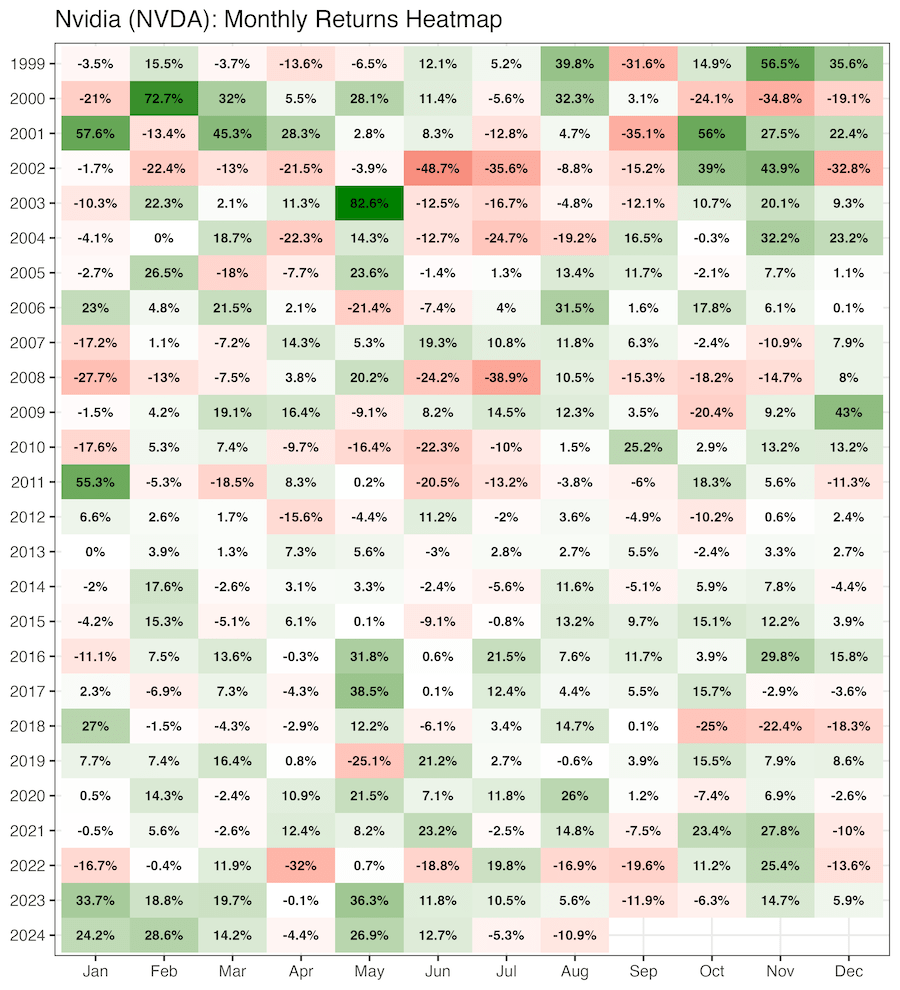
Want to display exact values or add custom labels to your heatmap cells? This comprehensive guide shows you exactly how to add ggplot2 heatmap text annotation using geom_text(), geom_label(), and advanced formatting techniques for professional data visualizations. Heatmaps are excellent for visualizing data patterns through color intensity, but sometimes you need to show precise values… Continue reading How to add text annotation to heatmap with ggplot2