
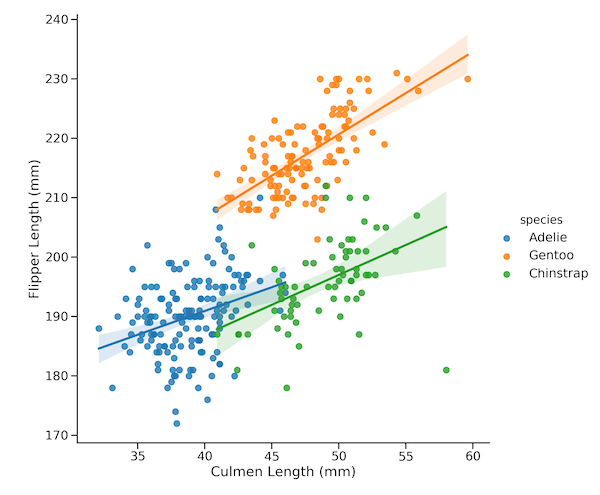
In this tutorial, we will learn how to add regression line per group to a scatter plot with Seaborn in Python. Seaborn has multiple functions to make scatter plots between two quantitative variables. For example, we can use lmplot(), regplot(), and scatterplot() functions to make scatter plot with Seaborn. However, they differ in their ability… Continue reading How To Add Regression Line Per Group with Seaborn in Python?
How To Make Grouped Violinplot with ggplot2 in R?

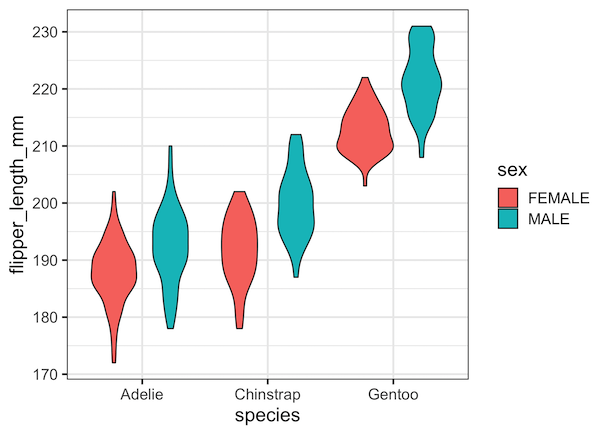
In this tutorial, we will see examples of how to make grouped violinplots using ggplot2’s geom_violin() function. Violinplots are like boxplot for visualizing numerical distributions for multiple groups. In comparison to boxplot, Violin plot adds information about density of distributions to the plot. A grouped violin plot is great for visualizing multiple grouping variables. Let… Continue reading How To Make Grouped Violinplot with ggplot2 in R?
How to Make Grouped Violinplot with Seaborn in Python?

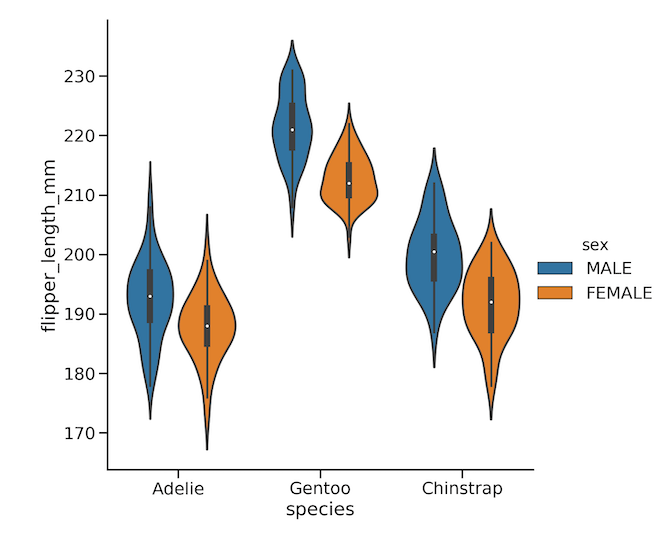
In this tutorial, we will learn how to make grouped violinplots with Seaborn in Python. In Seaborn, we have atleast two ways to make violinplots using Seaborn in Pyhon. First is to use violinplot() function and make violinplot. And the second option is to use Seaborn’s catplot() function. In this post, we will start with… Continue reading How to Make Grouped Violinplot with Seaborn in Python?
Best ggplot2 Themes to Make Your R Plots Look Professional (2025 Guide)


Creating professional-looking data visualizations in R starts with choosing the right ggplot2 theme. While ggplot2’s default gray theme works for basic plots, selecting the right theme can transform your visualizations from amateur to publication-ready. In this comprehensive guide, you’ll discover 10+ ggplot2 themes that will make your R plots look professional and polished with literally… Continue reading Best ggplot2 Themes to Make Your R Plots Look Professional (2025 Guide)
How To Make Bubble Plot with Seaborn Scatterplot in Python?

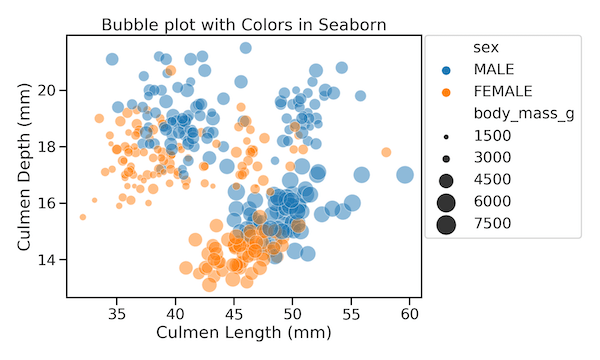
Bubble plots are scatter plots with bubbles (color filled circles) instead of data points. Bubbles have different sizes based on another variable in the data. Also bubbles can be of different color based on another variable in the dataset. Let us load the libraries needed. 👉 Want more? Explore the full Seaborn Tutorial Hub with… Continue reading How To Make Bubble Plot with Seaborn Scatterplot in Python?