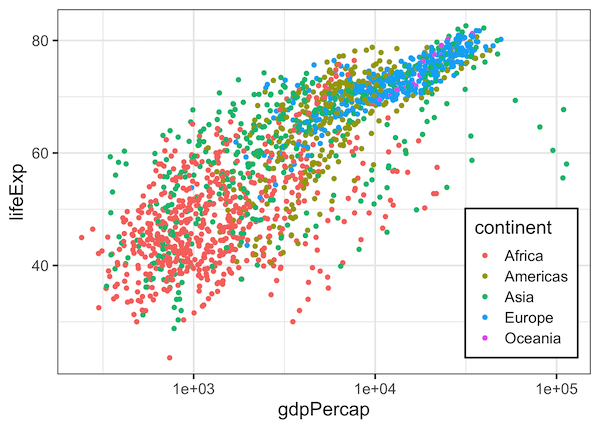
By default, when we make a plot with legend using ggplot2, it places the legend outside of the plot on the right side. Sometimes one might want to place the legend inside the plot. One of the advantages of placing it inside is that we may gain additional space for the plot.
In this post, we will learn how to adjust the legend position and place the legend position inside the plot. We will use ggplot2’s theme() function and legend.position argument to put the legend inside the plot.
Let us load tidyverse and load gapminder data for making a scatter plot with legend.
library(tidyverse)
How to Move Legend to inside plot in ggplot2?
We can move the ggplot2 legend inside the plot, when there is empty space inside. We can specify the location of legend using ggplot2 function theme(). Here we specify legend.position = c(0.87,0.25) to place the legend inside. The tuple basically specifies the x and y position in terms of the plot size in unit scale.
gapminder %>%
  ggplot(aes(gdpPercap,lifeExp, color=continent)) +
  geom_point() +
  scale_x_log10()+
  theme(legend.position = c(0.87, 0.25))
How to Move Legend to inside plot and Customize Legend Background in ggplot2?
In addition to placing the legend inside, we can also customize the legend box using legend.background argument inside theme() function. Here we make the legend box filled with white color and black color outline.
gapminder %>%
  ggplot(aes(gdpPercap,lifeExp, color=continent)) +
  geom_point() +
  scale_x_log10()+
  theme(legend.position = c(0.87, 0.25),
        legend.background = element_rect(fill = "white", color = "black"))
