While making plots with legend, like scatterplot, Seaborn has a nice feature that finds a suitable place for legend and puts it automatically inside the plot. This greatly helps in utilizing plotting area efficiently. However, sometimes you might want the legend outside the plot.
In this tutorial, we will see an example of how to place legend outside the plot using Seaborn scatterplot() function.
👉 Want more? Explore the full Seaborn Tutorial Hub with 35+ examples, code recipes, and best practices.
First, let us load the libraries needed for making the Seaborn plot.
import matplotlib.pyplot as plt
import pandas as pd
import seaborn as sns
We will use the fantastic data on Penguins made available as a data package by Allison Horst.
penguins_data="https://raw.githubusercontent.com/datavizpyr/data/master/palmer_penguin_species.tsv"
Penguins data can be loaded directly from datavizpyr.com‘s gitgub page.
penguins_df = pd.read_csv(penguins_data, sep="\t")
And this is how the data looks.
penguins_df.head()

species	island	culmen_length_mm	culmen_depth_mm	flipper_length_mm	body_mass_g	sex
0	Adelie	Torgersen	39.1	18.7	181.0	3750.0	MALE
1	Adelie	Torgersen	39.5	17.4	186.0	3800.0	FEMALE
2	Adelie	Torgersen	40.3	18.0	195.0	3250.0	FEMALE
3	Adelie	Torgersen	NaN	NaN	NaN	NaN	NaN
4	Adelie	Torgersen	36.7	19.3	193.0	3450.0	FEMALE
Simple Scatter Plot with Legend in Seaborn’s scatterplot()
Let us make simple scatter plot using Seaborn’s scatterplot() function using Penguin’s Culmen length and depth on x and y-axis. Let us use “hue” to color the data points by Penguin species. When we add the third variable like this to the scatter plot, Seaborn automatically adds the legend and with the matching color.
sns.set_context("talk", font_scale=1.1)
plt.figure(figsize=(8,6))
sns.scatterplot(x="culmen_length_mm",
                y="culmen_depth_mm",
                hue="species",
                data=penguins_df)
plt.xlabel("Culmen Length (mm)")
plt.ylabel("Culmen Depth (mm)")
plt.title("Seaborn Default Legend Position")
plt.savefig("default_legend_position_Seaborn_scatterplot.png",
                    format='png',dpi=150)
We can see that Seaborn places the legend automatically inside the scatter plot.


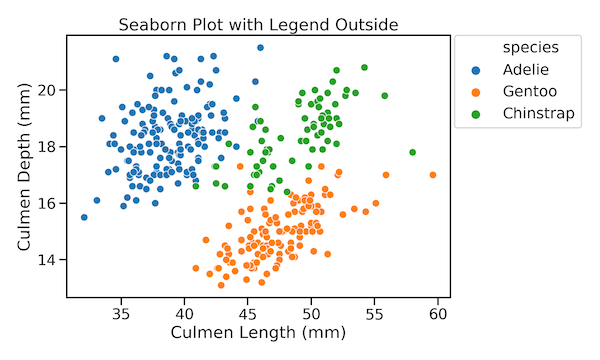
Move Legend to Outside the Plotting Area with Matplotlib in Seaborn’s scatterplot()
When legend inside the plot obscures data points on a plot, it is a better idea to move the legend to outside the plot. We can move the legend on Seaborn plot to outside the plotting area using Matplotlib’s help. We first make the scatterplot with legend as before. And then use the Matplotlib’s plot object and change legend position using legend() function. Inside the legend() function, we specify the coordinates of legend box as a tuple using the argument bbox_to_anchor.
We have also used plt.tight_layout() to make sure the legend box does not get cropped while saving the figure as image file.
sns.set_context("talk", font_scale=1.1)
plt.figure(figsize=(10,6))
sns.scatterplot(x="culmen_length_mm",
                y="culmen_depth_mm",
                hue="species",
                data=penguins_df)
plt.xlabel("Culmen Length (mm)")
plt.ylabel("Culmen Depth (mm)")
# place the legend outside the figure/plot
plt.legend(bbox_to_anchor=(1.01, 1),
           borderaxespad=0)
plt.title("Seaborn Plot with Legend Outside")
plt.tight_layout()
plt.savefig("place_legend_outside_plot_Seaborn_scatterplot.png",
                    format='png',dpi=150)
By adjusting the coordinates we can place the legend box out side the plot, but at a suitable position. Here we have made the box to align to the top of the plot. We also specify the spacing between the legend box and the plot by spacing padding size with the argument “borderaxespad”. And we get a nice scatter plot with legend outside the plot.