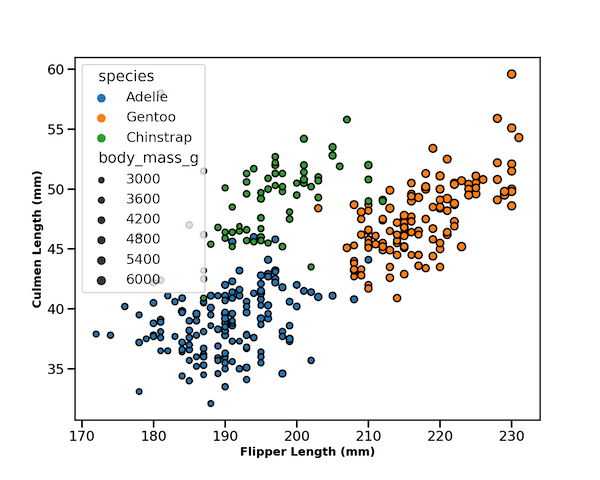
Seaborn’s scatterplot function allows us to make compelling scatter plots easily. In this post we will learn how to customize edge color of a scatter plot made with Seaborn. By default, Seaborn’s scatter plot function colors the markers edge color to be white. In this post, we will see how to change the default edge… Continue reading How To Change Edge Color on Seaborn Scatter Plot?
Category: Seaborn Scatterplot
How To Make Scatter Plots with Seaborn scatterplot in Python?
Scatter plots are great way to visualize two quantitative variables and their relationships. Often we can add additional variables on the scatter plot by using color, shape and size of the data points. With Seaborn in Python, we can make scatter plots in multiple ways, like lmplot(), regplot(), and scatterplot() functions. In this tutorial, we… Continue reading How To Make Scatter Plots with Seaborn scatterplot in Python?
