Matplotlib Cookbook & Tutorial Hub
A practical, copy-ready guide to Matplotlib with examples you actually use at work. Organized by chart family, with code snippets, formatting tips, and pitfalls—plus deep-dive links to full tutorials on datavizpyr.com.
Why Matplotlib? It’s the foundational plotting library in Python; Seaborn and pandas plotting build on it. When you need pixel-level control—custom annotations, shapes, and tick formats—Matplotlib is your best friend.
What this hub covers: Scatter/line, bars with labels, histograms, heatmaps, time series, and styling (ticks, labels, rectangles). Each section starts with a short explanation, a minimal code example, and curated links to go deeper.
How to use it: Skim the examples, then jump to the specific tutorial that matches your task. Code tested with Matplotlib 3.7+.
Matplotlib Scatter & Line Plots
Start simple with ax.plot or ax.scatter; add label/legend for groups and use alpha to handle overlap, looping per group for multi-category data.
import matplotlib.pyplot as plt
import numpy as np

rng = np.random.default_rng(2)
x = rng.normal(size=60)
y = 0.6*x + rng.normal(scale=0.7, size=60)
g = np.where(x > 0, "A", "B")

fig, ax = plt.subplots(figsize=(6,4))
for grp in ["A","B"]:
    m = g == grp
    ax.scatter(x[m],
               y[m],
               alpha=0.85,
               label=f"Group {grp}")
ax.legend(frameon=False, title="Group")
ax.set(title="Scatter by group",
       xlabel="X",
       ylabel="Y")
plt.tight_layout()
plt.savefig("Matplotlib_scatter_plot.png")
plt.show()


-
Color scatterplot by a variable (Matplotlib)
Shows how to map a categorical or numeric variable to point colors and keep the palette consistent across groups.
-
Legend for color-mapped scatter
Walks through creating a clean, informative legend tied to your color mapping with frame and placement tweaks.
-
Connect paired points with lines
Demonstrates linking matched observations with line segments to emphasize change or before–after relationships.
Matplotlib Bar Charts with Direct Labels
For few categories, bars are efficient; label bars with ax.bar_label so values are readable without scanning tables or tooltips.
import matplotlib.pyplot as plt
import numpy as np

# Define the category labels for the x-axis
cats = ["A", "B", "C"]
# Create numeric positions for each category (0, 1, 2)
x = np.arange(len(cats))
# Set the bar width (controls spacing between grouped bars)
w = 0.38
# Define values for the first group (e.g., year 2024)
v1 = [5, 7, 3]
# Define values for the second group (e.g., year 2025)
v2 = [4, 6, 6]
# Create a figure and axis object
fig, ax = plt.subplots(figsize=(6, 4))
# Plot the first group of bars, shifted left by half the bar width
r1 = ax.bar(x - w/2, v1, width=w, label="2024")
# Plot the second group of bars, shifted right by half the bar width
r2 = ax.bar(x + w/2, v2, width=w, label="2025")
# Add numeric labels on top of each bar for both groups
for r in (r1, r2):
    ax.bar_label(r, fmt="%.0f", padding=2)
# Set x-axis ticks to the numeric positions
ax.set_xticks(x)
# Replace numeric ticks with category labels
ax.set_xticklabels(cats)
# Add a label for the y-axis
ax.set_ylabel("Value")
# Add a title to the chart
ax.set_title("Grouped bars with labels")
# Add a legend showing group labels (without a border box)
ax.legend(frameon=False)
# Adjust layout so labels/titles don’t overlap with figure edges
plt.tight_layout()
plt.savefig("Matplotlib_grouped_barplot_with_annotation.png")
# Display the chart
plt.show()

-
Bar plots with Matplotlib
Covers the essentials for single-series bar charts including orientation, colors, and axis tick formatting tips.
-
Grouped barplots with Matplotlib
Explains how to position groups with width offsets and align category labels cleanly on the x-axis.
-
Annotate bars with
bar_labelShows practical patterns to place and format bar value labels for better readability on dense charts.
-
Annotate grouped barplot
Provides concise loops to label each bar across multiple series without misalignment or overlaps.
Matplotlib Histograms (with Overlays)
Use consistent bins to compare distributions; add transparency for overlays and consider density scaling when shapes matter more than counts.
rng = np.random.default_rng(0)
a = rng.normal(0, 1.0, 600)
b = rng.normal(0.8, 1.2, 600)

fig, ax = plt.subplots(figsize=(6,4))
ax.hist(a,
        bins=30,
        alpha=0.6,
        density=True,
        label="A")
ax.hist(b,
        bins=30,
        alpha=0.6,
        density=True,
        label="B")
ax.legend(frameon=False);
ax.set(title="Overlapping histograms")
plt.tight_layout();
plt.savefig("Overlapping_histogram_Matplotlib.png")
plt.show()

-
Histograms with Matplotlib
Details bin count/width choices, density versus frequency, and layout tweaks for intuitive comparisons.
-
Overlapping histograms in Matplotlib
Explains how to layer multiple histograms with transparency and consistent binning for fair side-by-side reading.
Matplotlib Heatmaps
Correlation matrices and data-quality scans are fast with ax.imshow; add a colorbar and set tick labels for orientation.
import matplotlib.pyplot as plt
import numpy as np

# Generate a random dataset with 5 variables and 200 observations
mat = np.corrcoef(np.random.randn(200, 5), rowvar=False)

# Create labels for variables (Var1, Var2, …)
labels = [f"Var{i+1}" for i in range(mat.shape[0])]

# Create a figure and axis
fig, ax = plt.subplots(figsize=(6, 5))

# Display correlation heatmap with a diverging palette
# RdBu_r: blue for negative, red for positive, white ~ 0
im = ax.imshow(mat, cmap="Spectral_r", vmin=-1, vmax=1)

# Add colorbar with label
cbar = fig.colorbar(im, ax=ax, shrink=0.85)
cbar.set_label("Correlation", rotation=270, labelpad=15)

# Set ticks to match variables
ax.set_xticks(np.arange(len(labels)))
ax.set_yticks(np.arange(len(labels)))
ax.set_xticklabels(labels)
ax.set_yticklabels(labels)

# Rotate x-axis labels for readability
plt.setp(ax.get_xticklabels(), rotation=45, ha="right", rotation_mode="anchor")

# Add a descriptive title
ax.set_title("Correlation Heatmap with Improved Color Palette")

# Adjust layout so everything fits
plt.tight_layout()
plt.savefig("Matplotlib_heatmap.png")
plt.show()


-
Heatmap with Matplotlib
Walks from basic imshow heatmaps to annotated matrices and includes colorbar and layout adjustments.
-
Visualize DataFrame NAs as heatmap
Shows how to map missing values across a DataFrame to quickly spot patterns and data integrity issues.
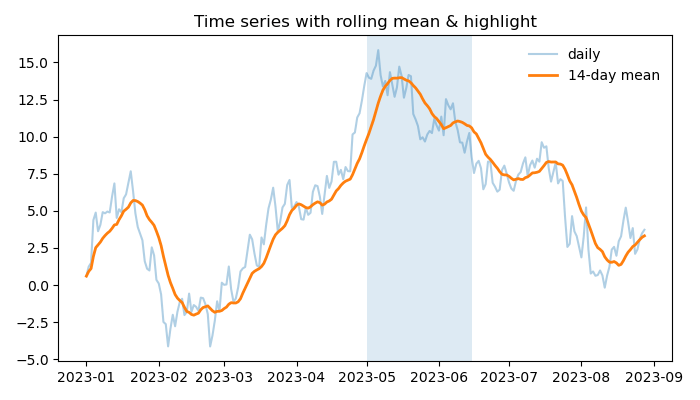
Matplotlib Time Series (Rolling & Highlights)
Blend raw series with a rolling mean for context and use axvspan to highlight regimes such as events, seasons, or outages.
import matplotlib.pyplot as plt
import pandas as pd
import numpy as np

# Create a daily date range starting from Jan 1, 2023 with 240 days
idx = pd.date_range("2023-01-01", periods=240, freq="D")

# Generate a random cumulative sum series to simulate a time series
s = pd.Series(np.random.randn(240).cumsum(), index=idx)

# Compute a 14-day rolling mean (moving average), allowing shorter windows at the start
roll = s.rolling(14, min_periods=1).mean()

# Create a figure and axis with custom size
fig, ax = plt.subplots(figsize=(7, 4))

# Plot the raw daily time series with transparency
ax.plot(s.index, s.values, alpha=0.35, label="daily")

# Plot the 14-day rolling mean with a thicker line
ax.plot(roll.index, roll.values, linewidth=2, label="14-day mean")

# Highlight a specific time window (May 1 to June 15) with a shaded background
ax.axvspan("2023-05-01", "2023-06-15", alpha=0.15)

# Add a legend without a frame box
ax.legend(frameon=False)

# Set a title for the plot
ax.set(title="Time series with rolling mean & highlight")

# Adjust layout so labels and title fit neatly in the figure
plt.tight_layout()
plt.savefig("Matplotlib_time_series_rolling_mean_plot.png")
# Display the plot
plt.show()

-
Time series with pandas
Introduces datetime indexes, resampling, and base line plots for time-stamped data using pandas+Matplotlib.
-
Rolling average in Python
Explains window choices, centered vs trailing means, and min_periods with clear Matplotlib overlays.
-
Highlight a time range
Shows
axvspantechniques to shade intervals and annotate events without hiding the main signal.
Styling & Formatting (Ticks, Labels, Shapes)
Use formatters to speak users’ language (currency/percent), give labels breathing room, and add rectangles for contextual focus.
import matplotlib.pyplot as plt
from matplotlib.ticker import FuncFormatter

def dollars(v, _): return f"${v:,.0f}"

fig, ax = plt.subplots(figsize=(6,4))
ax.plot([1,2,3,4], [2000, 3500, 2600, 4200], marker="o")
ax.yaxis.set_major_formatter(FuncFormatter(dollars))
ax.set_xlabel("Quarter", labelpad=8)
ax.set_title("Revenue trend")
plt.tight_layout(); plt.show()-
Add dollar sign to axis ticks
Covers currency tick formatters with thousands separators and sensible rounding for dashboards and reports.
-
Adjust axis label positions
Shows label padding, rotation, and placement tweaks that prevent collisions and improve legibility.
-
Draw rectangle for highlights
Uses patches to call attention to important time windows or value regions without overwhelming the plot.
-
Change Matplotlib plot style
Explains using built-in and custom style sheets to create a consistent visual identity across charts.
General Matplotlib Recipes
Quick patterns you’ll reach for often—legends that don’t obscure data, text annotations, bubble plots, and stacked areas.
-
Legend for color-mapped scatter
Covers practical legend placement and styling so labels aid interpretation instead of hiding data.
-
Text annotations for points
Shows safe label placement and simple offsets to avoid overlaps while calling out notable points.
-
Bubble plot in Matplotlib
Explains using marker size to encode a third variable and how to scale and label bubbles clearly.
-
Stacked area plot
Shows layering multiple series to emphasize cumulative totals and long-term shifts in composition.
You may also like
Explore more topic hubs across datavizpyr.
Matplotlib FAQs
- What is Matplotlib best used for?
- Matplotlib is the “Swiss Army knife” of Python visualization. Whether you need a quick scatter plot or a fully customized figure, it gives you pixel-level control that no other library matches. Start with our Matplotlib examples collection for inspiration.
- How do I label bars so my charts are easier to read?
-
Use
ax.bar_label()to print values directly on top of bars. This small change makes charts instantly clearer. See our guide on annotating bars with bar_label() for code examples. - What’s the cleanest way to compare two histograms?
- Overlay histograms with the same bin edges and use transparency. This lets readers compare distributions side by side. Check our tutorial on overlapping histograms in Matplotlib for practical tips.
- How can I highlight a time period in my chart?
-
The secret weapon is
axvspan(). With one line you can shade campaigns, outages, or seasons to direct attention. Try our guide on highlighting time ranges in time series plots. - Can I make Matplotlib plots look modern and stylish?
-
Absolutely. Use
plt.style.use()with built-in or custom themes to unify fonts, colors, and grids. Our tutorial on changing Matplotlib plot styles shows how to upgrade your visuals quickly.