In this post, we will learn how to make bubbleplots using Matplotlib in Python. Bubble plot is a scatterplot, but with size of the data point on the scatter plot is coded by another variable. Basically, if the third variable is larger you get a bigger circle filled with a color i.e. bigger bubble and smaller bubble for smaller numerical value.
Let us load Pandas and Matplotlib.pyplot for making the bubble plots.
import matplotlib.pyplot as plt
import pandas as pd
We will simulate data using NumPy random module to make bubble plots in Python. We create x and y variable for making the scatter plot and we also create third variable for the size of bubbles in bubble plot. We can create a fourth variable for coloring the bubble plot in Python.
So, with bubble plot example here we show how to visualize four variables using the bubble plot; two variables on x and y axis, third variable as bubble and fourth variable with color of bubble.
np.random.seed(42)
N = 100
x = np.random.normal(170, 20, N)
y = x + np.random.normal(5, 25, N)
colors = np.random.rand(N)
area = (25 * np.random.rand(N))**2
Let us store the simulated data in a Pandas dataframe. Here we construct dataframe from NumPy arrays using Pandas’ DataFrame function and providing the variables as a dictionary .
df = pd.DataFrame({
    'X': x,
    'Y': y,
    'Colors': colors,
    "bubble_size":area})
Here are the four variables we simulated looks like.
df.head(n=3)

X	Y	Colors	bubble_size
0	179.934283	149.550015	0.877373	553.972491
1	167.234714	161.718581	0.740769	93.172029
2	182.953771	179.385908	0.697016	577.429562
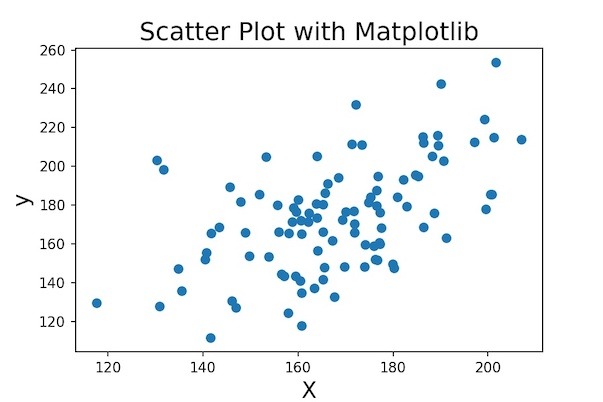
Let us first make a simple scatter plot with Matplotlib using scatter() function. The x and y-axis label sizes are smaller by default, when we make scatter plot using scatter function(). Here we customize the axis labels and their size using xlabel and ylabel functions. We also add a title to the scatter plot using plt.title().
# scatter plot with scatter() function
plt.scatter('X', 'Y', data=df)
plt.xlabel("X", size=16)
plt.ylabel("y", size=16)
plt.title("Scatter Plot with Matplotlib", size=18)
Our customized scatter plot looks like this.
Bubble Plot in Python
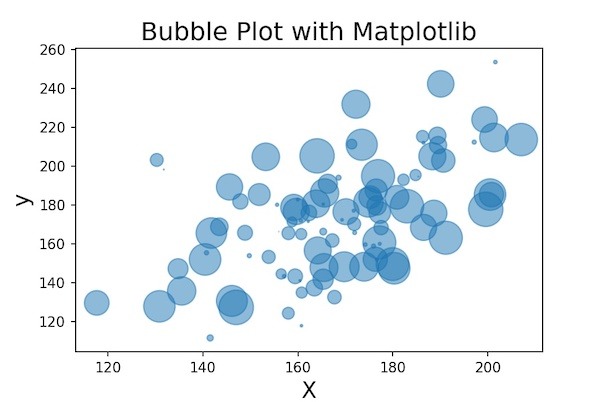
Using Matplotlib, we can make bubble plot in Python using the scatter() function. To make bubble plot, we need to specify size argument “s” for size of the data points.
In our example we use s=’bubble_size’.
# scatter plot with scatter() function
# transparency with "alpha"
# bubble size with "s"
plt.scatter('X', 'Y',
             s='bubble_size',
             alpha=0.5,
             data=df)
plt.xlabel("X", size=16)
plt.ylabel("y", size=16)
plt.title("Bubble Plot with Matplotlib", size=18)
We can see that the points in the scatter plots are bubbles now based on the value of size variable. By default, Matplotlib makes the bubble color as blue. We have also added transparency to the bubbles in the bubble plot using alpha=0.5.
Color Bubble Plot By Variable in Python
Let us color the bubbles differently using another variable in the bubble plot. The scatter() function has the argument “c” for specifying colors. And we use the argument c=”Colors” to color the bubble by a variable. Here, Colors is the quantitative variable that we created when we constructed the dataframe.
# scatter plot with scatter() function
# transparency with "alpha"
# bubble size with "s"
# color the bubbles with "c"
plt.scatter('X', 'Y',
             s='bubble_size',
             c='Colors',
             alpha=0.5, data=df)
plt.xlabel("X", size=16)
plt.ylabel("y", size=16)
plt.title("Bubble Plot with Colors: Matplotlib", size=18)
We get a nice colored bubble plot made with matplotlib.