
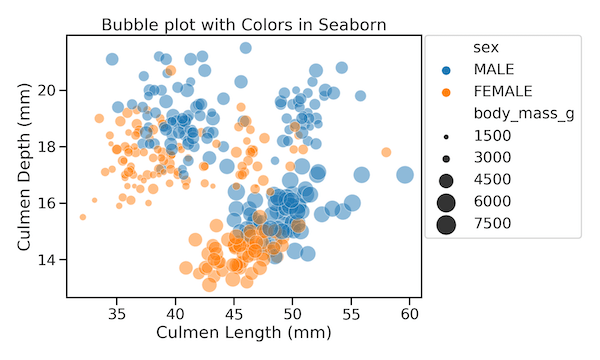
Bubble plots are scatter plots with bubbles (color filled circles) instead of data points. Bubbles have different sizes based on another variable in the data. Also bubbles can be of different color based on another variable in the dataset. Let us load the libraries needed. 👉 Want more? Explore the full Seaborn Tutorial Hub with… Continue reading How To Make Bubble Plot with Seaborn Scatterplot in Python?
Tag: Bubble Plot
How To Make Bubble Plot in Python with Matplotlib?


In this post, we will learn how to make bubbleplots using Matplotlib in Python. Bubble plot is a scatterplot, but with size of the data point on the scatter plot is coded by another variable. Basically, if the third variable is larger you get a bigger circle filled with a color i.e. bigger bubble and… Continue reading How To Make Bubble Plot in Python with Matplotlib?
How To Make Bubble plot with Altair in Python?

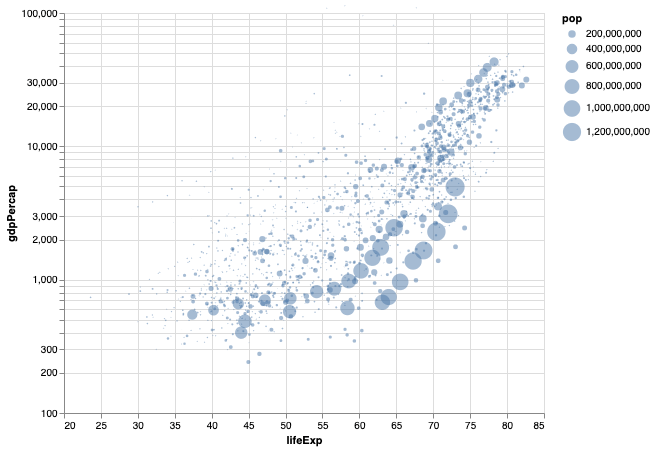
Bubble plot is a data visualization technique that shows bubbles i.e. circles on a two dimensional plot. Bubble plot is simply a scatter plot where we plot bubbles/circles instead of points in a scatter plot. Bubble chart is useful when you have three variables and the size of the bubbles show the third variable. In… Continue reading How To Make Bubble plot with Altair in Python?