
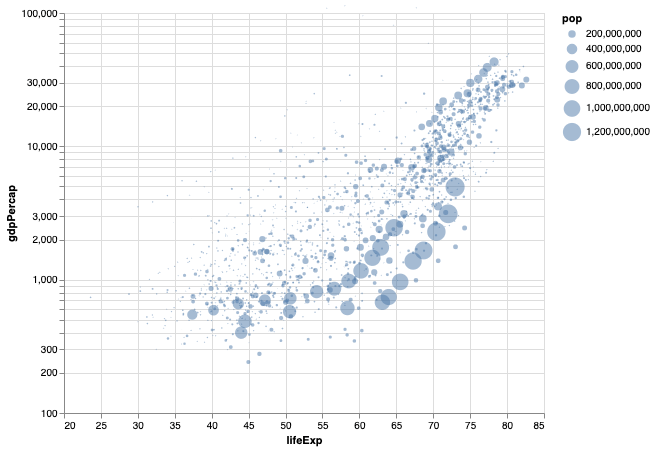
Bubble plot is a data visualization technique that shows bubbles i.e. circles on a two dimensional plot. Bubble plot is simply a scatter plot where we plot bubbles/circles instead of points in a scatter plot. Bubble chart is useful when you have three variables and the size of the bubbles show the third variable. In… Continue reading How To Make Bubble plot with Altair in Python?