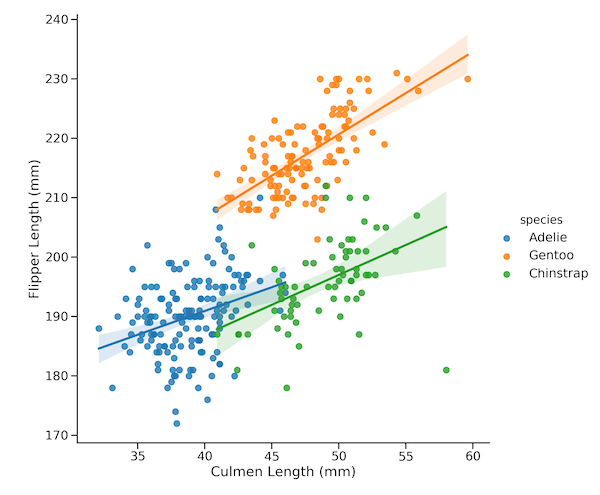
In this tutorial, we will learn how to add regression line per group to a scatter plot with Seaborn in Python. Seaborn has multiple functions to make scatter plots between two quantitative variables. For example, we can use lmplot(), regplot(), and scatterplot() functions to make scatter plot with Seaborn. However, they differ in their ability… Continue reading How To Add Regression Line Per Group with Seaborn in Python?
Category: Seaborn
How to Make Grouped Violinplot with Seaborn in Python?
In this tutorial, we will learn how to make group violinplots with Seaborn in Python. In Seaborn, we have atleast two ways to make violinplots using Seaborn in Pyhon. First is to use violinplot() function and make violinplot. And the second option is to use Seaborn’s catplot() function. In this post, we will start with… Continue reading How to Make Grouped Violinplot with Seaborn in Python?
How To Place Legend Outside the Plot with Seaborn in Python?
While making plots with legend, like scatterplot, Seaborn has a nice feature that finds a suitable place for legend and puts it automatically inside the plot. This greatly helps in utilizing plotting area efficiently. However, sometimes you might want the legend outside the plot. In this tutorial, we will see an example of how to… Continue reading How To Place Legend Outside the Plot with Seaborn in Python?
How to Show Mean on Boxplot using Seaborn in Python?
Boxplots show five summary statistics, including median, derived from data to show distribution of numerical data corresponding categorical variables. Sometimes, you might want to highlight the mean values in addition to the five statistics of boxplot. In this post we will see how to show mean mark on boxplot using Seaborn in Python. We will… Continue reading How to Show Mean on Boxplot using Seaborn in Python?
How to Annotate Bars in Grouped Barplot in Python?
In this post we will learn examples of adding text, annotating bars in grouped barplot using matplotlib. We will first see how to make grouped barplots using Seaborn’s barplot() function and then use Matplotlib to add annotations to the grouped bars. The way to add annotation to grouped barplot is very similar to the way… Continue reading How to Annotate Bars in Grouped Barplot in Python?
