
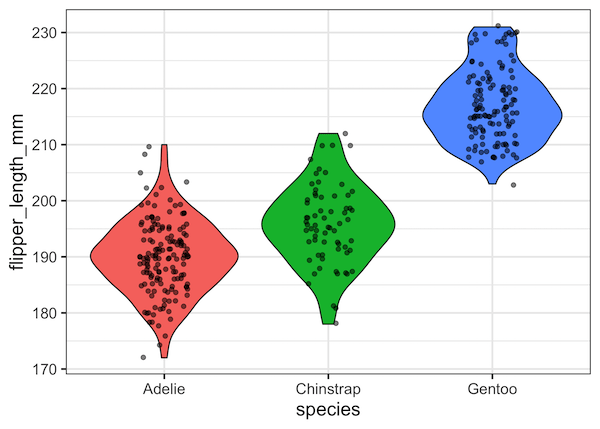
Violinplots are a great alternative to boxplot, as it combines boxplot and density plot. In this tutorial, we will see examples of how to make violinplots with using ggplot2’s geom_violin() function. Violinplots are like boxplot for visualizing numerical distributions for multiple groups. In comparison to boxplot, Violin plot adds information about density of distributions to… Continue reading How To Make Violinplot with Data Points in R?
Tag: Violinplot
How To Make Violinpot with data points in Seaborn?

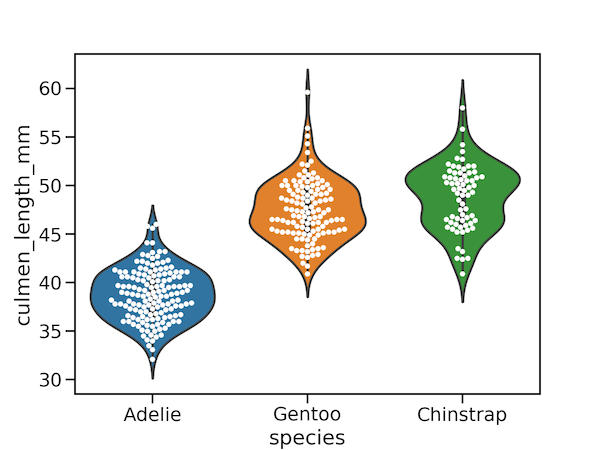
Violinplots are combination of boxplot and density plots. In this tutorial we will learn how to make Violinplots with Seaborn in Python and also show actual data points with violin plot. 👉 Want more? Explore the full Seaborn Tutorial Hub with 35+ examples, code recipes, and best practices. We will use Penguin data set to… Continue reading How To Make Violinpot with data points in Seaborn?
How To Make Grouped Violinplot with ggplot2 in R?

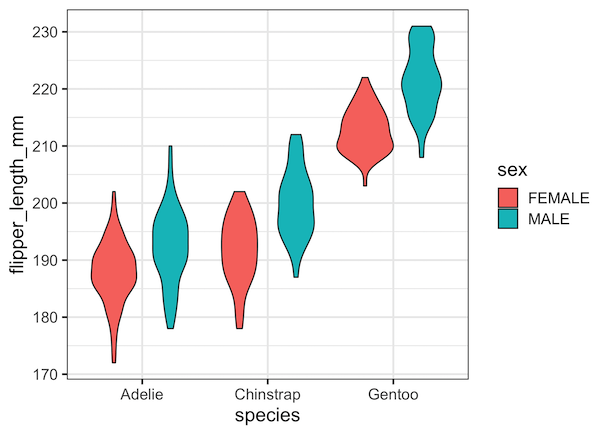
In this tutorial, we will see examples of how to make grouped violinplots using ggplot2’s geom_violin() function. Violinplots are like boxplot for visualizing numerical distributions for multiple groups. In comparison to boxplot, Violin plot adds information about density of distributions to the plot. A grouped violin plot is great for visualizing multiple grouping variables. Let… Continue reading How To Make Grouped Violinplot with ggplot2 in R?
How to Make Grouped Violinplot with Seaborn in Python?

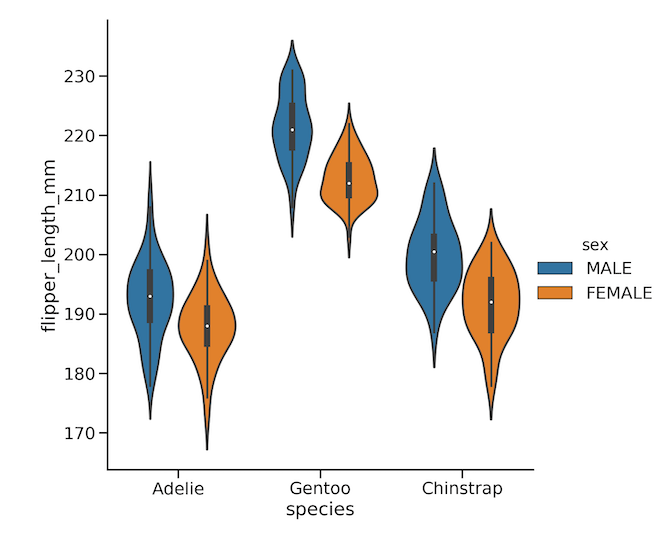
In this tutorial, we will learn how to make grouped violinplots with Seaborn in Python. In Seaborn, we have atleast two ways to make violinplots using Seaborn in Pyhon. First is to use violinplot() function and make violinplot. And the second option is to use Seaborn’s catplot() function. In this post, we will start with… Continue reading How to Make Grouped Violinplot with Seaborn in Python?
How to Make Horizontal Violin Plot with Seaborn in Python?

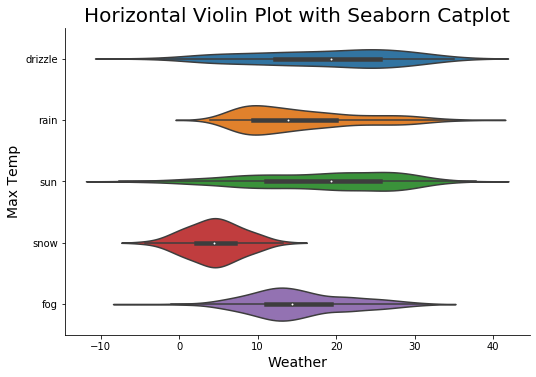
In this tutorial, we will learn how to make horizontal violin plot in Seaborn with Python. With Seaborn, we can use two similar functions, catplot() and violinplot() to make violin plots. Making a violinplot horizontal with Seaborn is pretty simple. All we need to do is specify the categorical variable on y-axis and the numerical… Continue reading How to Make Horizontal Violin Plot with Seaborn in Python?