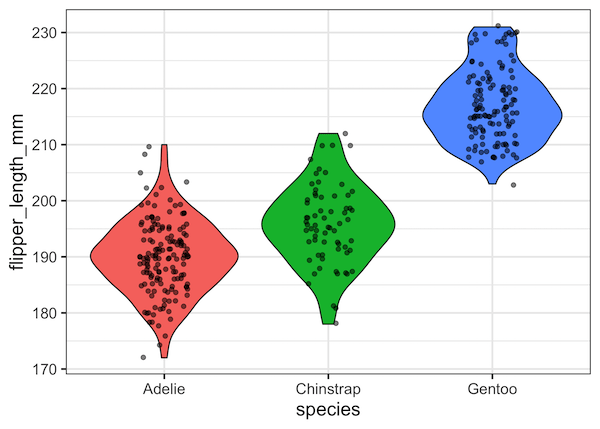
Violinplots are a great alternative to boxplot, as it combines boxplot and density plot. In this tutorial, we will see examples of how to make violinplots with using ggplot2’s geom_violin() function. Violinplots are like boxplot for visualizing numerical distributions for multiple groups. In comparison to boxplot, Violin plot adds information about density of distributions to… Continue reading How To Make Violinplot with Data Points in R?
