In this tutorial, we will learn how to make horizontal violin plot in Seaborn with Python. With Seaborn, we can use two similar functions, catplot() and violinplot() to make violin plots. Making a violinplot horizontal with Seaborn is pretty simple. All we need to do is specify the categorical variable on y-axis and the numerical variable on x-axis with Seaborn functions for making violinplot.
👉 Want more? Explore the full Seaborn Tutorial Hub with 35+ examples, code recipes, and best practices.
Let us load the packages needed to make horizontal violin plots.
import seaborn as sns
import matplotlib.pyplot as plt
import pandas as pd
We will use Seattle weather data available from vega-datasets’ github page. We cab directly load the data from the website using Pandas’ read_csv() function.
weather_df = pd.read_csv("https://raw.githubusercontent.com/vega/vega-datasets/master/data/weather.csv")
print(weather_df.head(n=3))

  location        date  precipitation  temp_max  temp_min  wind  weather
0  Seattle  2012-01-01            0.0      12.8       5.0   4.7  drizzle
1  Seattle  2012-01-02           10.9      10.6       2.8   4.5     rain
2  Seattle  2012-01-03            0.8      11.7       7.2   2.3     rain
We will first use Seaborn’ Catplot function to make horizontal violinplot and then use Seaborn’s violinplot() function.
How Make Horizontal Violin Plot with Catplot in Seaborn?
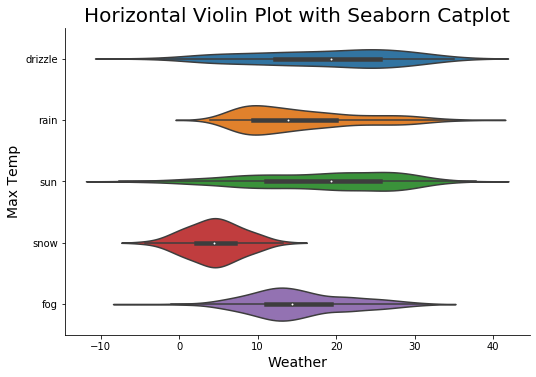
Let us catplot() in Seaborn to make the horizontal violin plot. As catplot() function can be used for number of plot types, we need to use kind=”violin”, after specifying the x and y axis variables.
# horizontal violinplot with catplot seaborn
vio_plot = sns.catplot(x="weather", y="temp_max", kind="violin", aspect=2,data=weather_df)
plt.xlabel("Weather", size=14)
plt.ylabel("Max Temp", size=14)
plt.title("Violin Plot with Seaborn Catplot", size=20)
vio_plot.savefig("Violin_plot_with_catplot_Seaborn_Python.png")
Here we have also customized the figure size with aspect argument and set the axis labels and title.
How to Make Horizontal Violin Plot with violinplot in Seaborn ?
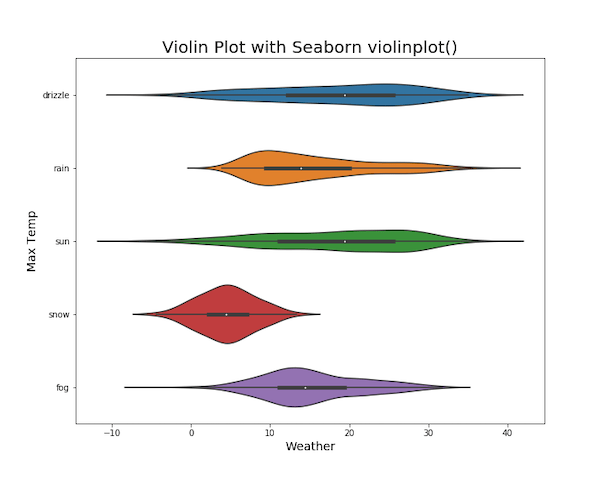
We can also make horizontal violin plot using Seaborn’s violinplot() function as follows.
# set figure size
plt.figure(figsize=(10,8))
# horizontal violinplot with catplot seaborn
vio_plot=sns.violinplot(x="weather", y="temp_max", data=weather_df)
plt.xlabel("Weather", size=14)
plt.ylabel("Max Temp", size=14)
plt.title("Violin Plot with Seaborn violinplot()", size=20)
plt.savefig("violin_plot_with_Seaborn_Python.png")