
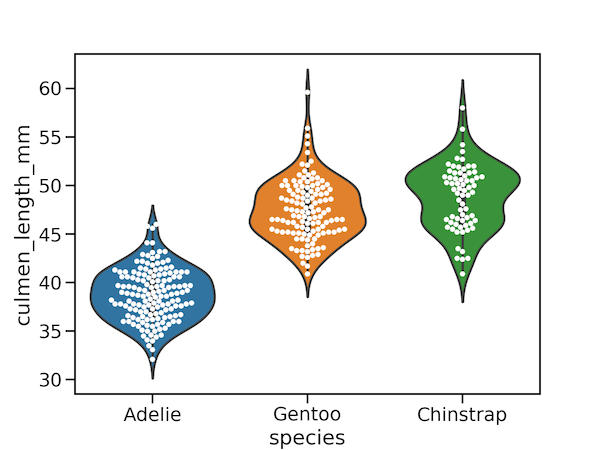
Violinplots are combination of boxplot and density plots. In this tutorial we will learn how to make Violinplots with Seaborn in Python and also show actual data points with violin plot. 👉 Want more? Explore the full Seaborn Tutorial Hub with 35+ examples, code recipes, and best practices. We will use Penguin data set to… Continue reading How To Make Violinpot with data points in Seaborn?