
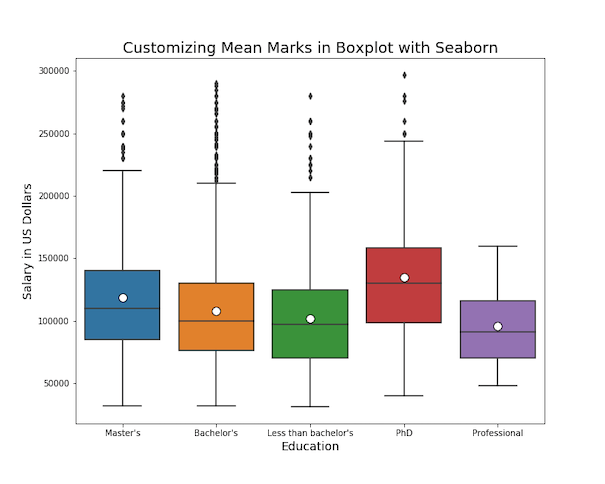
Want to display both median and mean values in your boxplot visualizations? This comprehensive guide shows you exactly how to seaborn boxplot show mean using multiple methods, with ready-to-use Python code examples. Boxplots traditionally show median values, but displaying the mean alongside provides additional statistical insight, especially when dealing with skewed distributions or comparing central… Continue reading How to Show and Customize Mean Values in Seaborn Boxplots