
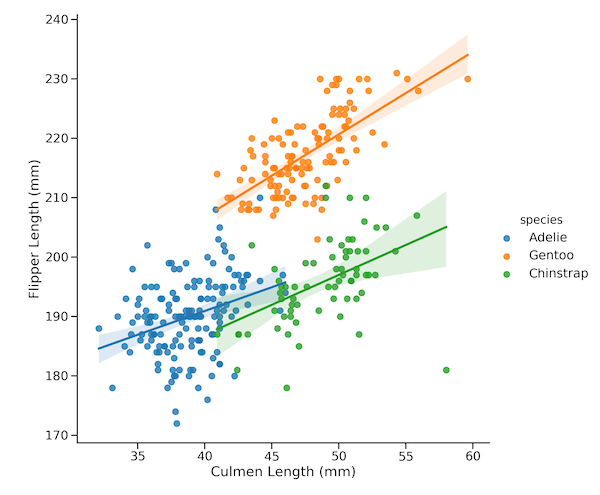
In this tutorial, we will learn how to add regression line per group to a scatter plot with Seaborn in Python. Seaborn has multiple functions to make scatter plots between two quantitative variables. For example, we can use lmplot(), regplot(), and scatterplot() functions to make scatter plot with Seaborn. However, they differ in their ability… Continue reading How To Add Regression Line Per Group with Seaborn in Python?