
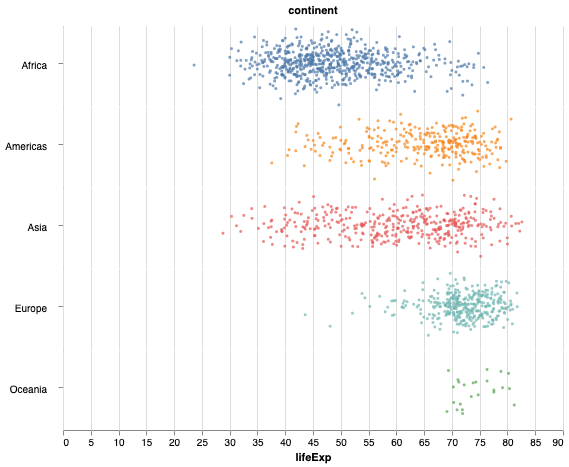
In this post, we will learn how to make horizontal stripplot with jitter using Altair in Python. In an earlier post we learned step-by-step instructions to make stripplot with jitter. We will use gapminder dataset to make the stripplot with Altair. Let us load the data from web using Pandas’s read_csv() function. We will primarily… Continue reading Horizontal Stripplot with Jitter using Altair in Python
Tag: Altair
How To Make Stripplot with Jitter in Altair Python?

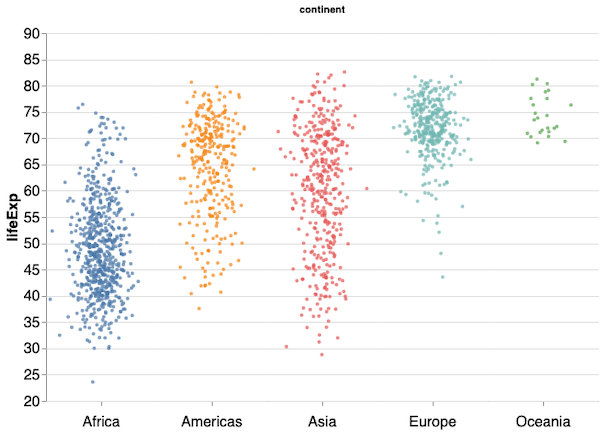
In this post we will learn how to make strip plots using Altair in Python. A simple strip plot is plotting the data as points and may not that useful. One way to make the simple striplplot more meaningful is to add random jitter. Making a stipplot with jitter in Altair is slightly tricky. Luckily,… Continue reading How To Make Stripplot with Jitter in Altair Python?
Area Chart with Altair in Python

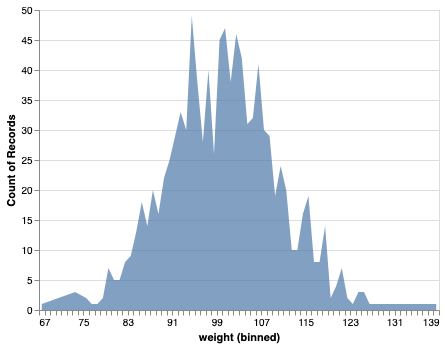
In this post, we will see how to make simple area chart with Altair in Python. Area chart displays a quantitative variable like a line plot or density plot but coloring the area under the curve. In Altair, we can make area chart with mark_area() function. Let us first load Altair and the needed packages.… Continue reading Area Chart with Altair in Python
How To Make Bubble plot with Altair in Python?

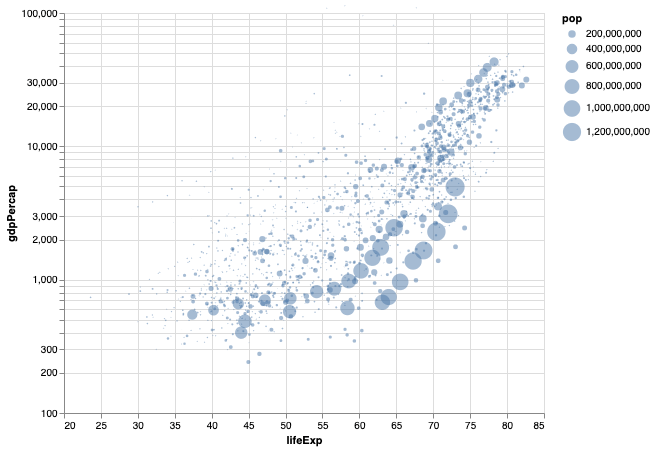
Bubble plot is a data visualization technique that shows bubbles i.e. circles on a two dimensional plot. Bubble plot is simply a scatter plot where we plot bubbles/circles instead of points in a scatter plot. Bubble chart is useful when you have three variables and the size of the bubbles show the third variable. In… Continue reading How To Make Bubble plot with Altair in Python?
How To Color a Scatter Plot by a Variable in Altair?
In this tutorial, we will learn how to color data points in a scatter plot by a variable using Altair in Python. Let us load Altair and Pandas. We will use gapminder data to make scatter plot first and color by a variable using Altair. To make a simple scatter plot with Altair we use… Continue reading How To Color a Scatter Plot by a Variable in Altair?