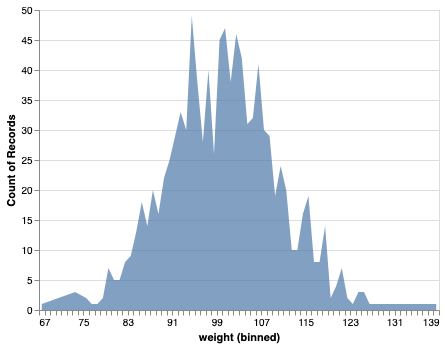
In this post, we will see how to make simple area chart with Altair in Python. Area chart displays a quantitative variable like a line plot or density plot but coloring the area under the curve. In Altair, we can make area chart with mark_area() function. Let us first load Altair and the needed packages.… Continue reading Area Chart with Altair in Python
