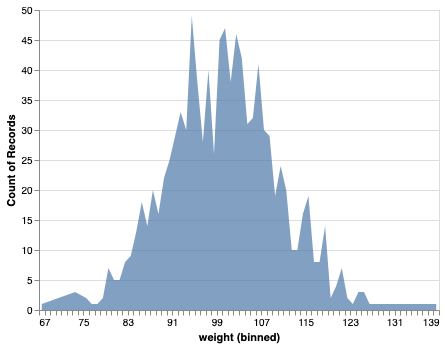
In this post, we will see how to make simple area chart with Altair in Python. Area chart displays a quantitative variable like a line plot or density plot but coloring the area under the curve. In Altair, we can make area chart with mark_area() function.
Let us first load Altair and the needed packages.
import altair as alt
import pandas as pd
import numpy as np
We will generate data to make area chart using NumPy’s random module and create a Pandas dataframe for it.
# Generating Data
np.random.seed(42)
df = pd.DataFrame({
    'weight': np.random.normal(100, 10, 1000)
})
Our data to make are chart is ready. Now we can provide the data to Altair’s chart object and use mark_area() function to specify that we are making area chart. And then specify our x axis and y-axis variables.
alt.Chart(df).mark_area(opacity=0.7).encode(
      alt.X('weight:Q', bin=alt.Bin(maxbins=100)),
      alt.Y('count(*):Q')
)
And we get a simple area chart as shown below.
