
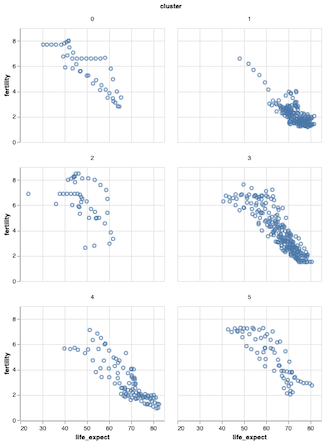
Faceting is a great technique to simplify a complex visualization. Faceting splits a single plot into multiple smaller plots containing subset of data corresponding to a group. This tutorial we will see an example of how to facet a scatter plot with Altair in Python. Let us first load the packages needed to use Altair… Continue reading How To Facet a Scatter Plot with Altair?
Tag: Altair
Scatter Plot with Regression Line using Altair in Python

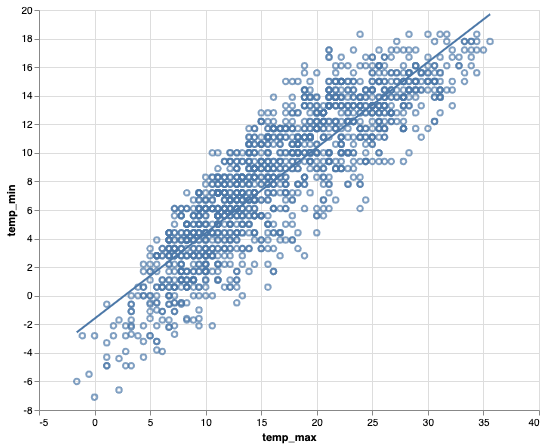
Adding regression line to scatter plot is a great way to understand the relationship between two numeric variables. In this post, we will see an example of using Altair to make a scatter plot with regression line using real world dataset. Let us load the packages we need. We will load Altair package and load… Continue reading Scatter Plot with Regression Line using Altair in Python
Simple Scatter Plot with Altair in Python

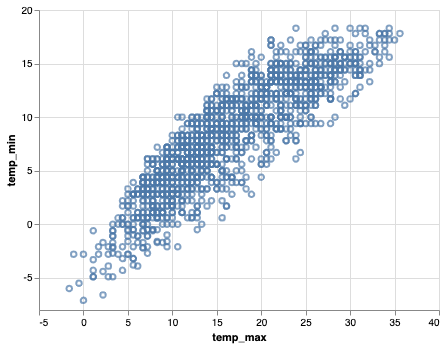
In this post, we will see an example of making a simple scatter plot using Altair 4.0.0. Altair is one latest interactive data visualization library in Python. Altair is based vega and Vega-lite – A Grammar of Interactive Graphics. Let us load Seattle weather data from vega_datasets Let us make scatter plot with Altair. We… Continue reading Simple Scatter Plot with Altair in Python