In this post, we will see an example of making a simple scatter plot using Altair 4.0.0. Altair is one latest interactive data visualization library in Python. Altair is based vega and Vega-lite – A Grammar of Interactive Graphics.
import altair as alt
from vega_datasets import data
Let us load Seattle weather data from vega_datasets
seattle_weather = data.seattle_weather()
print(seattle_weather.head(n=3))


        date  precipitation  temp_max  temp_min  wind  weather
0 2012-01-01            0.0      12.8       5.0   4.7  drizzle
1 2012-01-02           10.9      10.6       2.8   4.5     rain
2 2012-01-03            0.8      11.7       7.2   2.3     rain
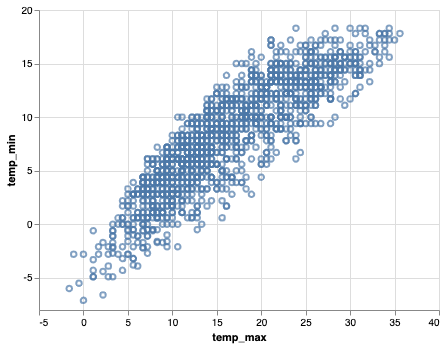
Let us make scatter plot with Altair. We first use Chart() function in Altair to provide the data and chain it with mark_point() function to make scatter plot. We then provide the aesthetics x and y axis to encode() function.
alt.Chart(seattle_weather).mark_point().encode(
    x='temp_max',
    y='temp_min'
)
As a result, we get a simple scatter plot between the two variables provided to the encode() function.
alt.Chart(seattle_weather).mark_point().encode(
    x='temp_max',
    y='temp_min'
)
We can save the Altair chart as html. Let us first store the Altair object in variable.
scatter_plot = alt.Chart(seattle_weather).mark_point().encode(
    x='temp_max',
    y='temp_min'
)
Altair’s save function can same the scatter plot as html file. The saved html file offers option to save as png file with other options.
scatter_plot.save('simple_scatter_plot_with_altairchart.html')
