library(ggplot2)
Let us create data frame with two variables to make a scatter plot in default ggplot2 theme.
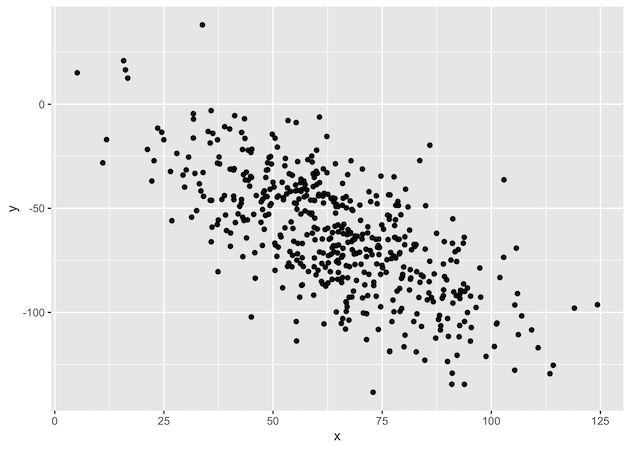
x <- rnorm(500, mean=65, sd=20)
y <- rnorm(500, mean=2, sd=20) - x
df <- data.frame(x=x, y=y)
Let us create a simple scatter plot with default grey theme.
df %>%
  ggplot(aes(x=x,y=y)) + geom_point()
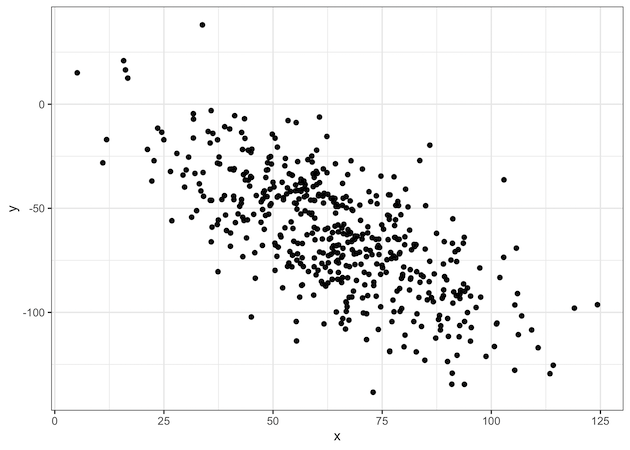
df %>%
   ggplot(aes(x=x,y=y)) + geom_point()+  theme_bw()
Explore the Complete ggplot2 Guide
35+ tutorials with code: scatterplots, boxplots, themes, annotations, facets, and more—tested and beginner-friendly.
Visit the ggplot2 Hub → No fluff—just code and visuals.