Faceting is a great technique to simplify a complex visualization. Faceting splits a single plot into multiple smaller plots containing subset of data corresponding to a group.
This tutorial we will see an example of how to facet a scatter plot with Altair in Python.
Let us first load the packages needed to use Altair and faceting on scatter plot. In this example, We use Altair version 4.0.
import altair as alt
import pandas as pd
import numpy as np
print(alt.__version__)
4.0.0
Let us use gapminder data set available from vega_datasets.
from vega_datasets import data
# load gapminder data
gapminder = data.gapminder()
# convert cluster variable into categorical variable
gapminder['cluster'] = gapminder['cluster'].astype('category')
We will use three variables, life_expect, fertility, and cluster from gaominder data to facet a scatter plot.
gapminder.head()
year	country	cluster	pop	life_expect	fertility
0	1955	Afghanistan	0	8891209	30.332	7.7
1	1960	Afghanistan	0	9829450	31.997	7.7
2	1965	Afghanistan	0	10997885	34.020	7.7
3	1970	Afghanistan	0	12430623	36.088	7.7
4	1975	Afghanistan	0	14132019	38.438	7.7
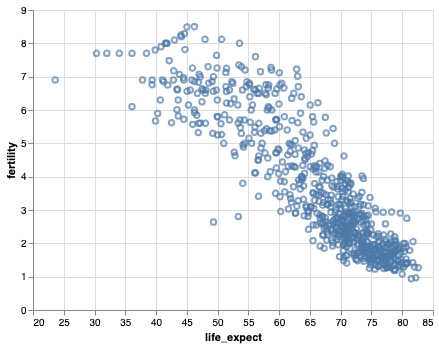
Let us first make a simple scatter plot using Altair and then add faceting as a additional layer.
alt.Chart(gapminder).mark_point().encode(
    x=alt.X('life_expect',scale=alt.Scale(domain=(20, 85))),
    y=alt.Y('fertility')
)
We have plotted a scatter plot between fertility and life expectancy from gapminder data using all the data.

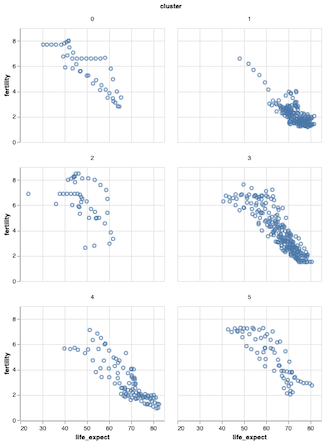
We see that the cluster variable groupbs the gapminder data into six groups. We can facet the scatter plot based on the values of cluster such that we have six scatter plots one each for each cluser.
Altair has a function facet() that we can use on the scatter plot object and add faceting layer. We provide the variable to use to facet the scatter plot and also specify the number of columns.
# facet a scatter plot with Altair
scatter_plot.facet(
    'cluster:N',
    columns=2
)
Faceting scatter plot produces a matrix of smaller plots as below. And this way to split a single complex plot into multiple small plots is widely known as “small multiples” and helps visualize data in a simple and meaningful way.