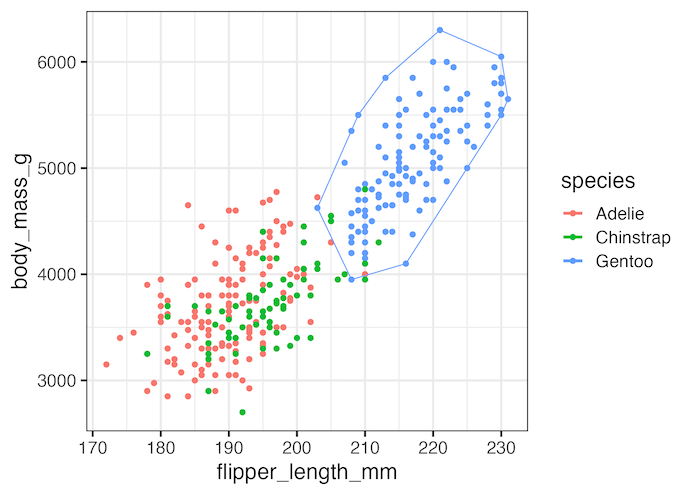
In this post, we will learn how to encircle data points with ggplot2. In R, there are multiple ways to highlight/annotate data points. Here we will use, ggalt, one of the ggplot2 extension packages to encircle data points. ggalt‘s geom_encircle() function can automagically encircle points belonging to multiple groups. Setting data and packages First, let… Continue reading How to encircle a set of points in R with ggplot2
How to wrap long title in ggplot2
In this post, we will learn how to wrap a long title into multiple lines in ggplot2. When your title to a plot made. with ggplot2 is really long, you only see a part of it in the plot. Here we will see examples of dealing with long ggplot2 title in four different ways. We… Continue reading How to wrap long title in ggplot2
How to write a function make histograms with ggplot
In this tutorial, we will learn how to write a function to make a histograms using ggplot2 in R. Writing a function to create plots is useful, when you make a lot of plots, in this example, a lot of histograms. Thanks to the upcoming 2nd edition of R for Data Science by Hadley Wickham,… Continue reading How to write a function make histograms with ggplot
How to selectively remove legends with ggplot2
In this post, we will see examples of removing some of the legends from a plot having multiple legends made with ggplot2. Legends in a plot help us understand the relationship between two variables in a plot with respect to other variables in the dataset. We will learn that we can remove all legends in… Continue reading How to selectively remove legends with ggplot2
How to Visualize Missing Values in a dataframe as heatmap
In this post, we will learn how to visualize a dataframe with missing values represented as NAs as a heatmap. A quick visualization of missing values in the data is useful in analyzing the data. We will use mainly tidyverse approach, first to create a toy dataframe with missing values, then use ggplot2’s geom_tile() function… Continue reading How to Visualize Missing Values in a dataframe as heatmap
