
Why Long Titles Get Cut Off in ggplot2
When working with ggplot2 in R, long titles often get truncated or extend beyond the plot area, making your visualization look unpolished. Fortunately, there are multiple ways to break or wrap a long title into multiple lines.
In this tutorial, we’ll explore five different methods—from adding newline characters to using stringr::str_wrap() and the ggtext package—so you can create clean, publication-ready plots. Each method comes with reproducible R code and output examples.
We will use palmer penguins dataset to make a plot with really long title.
library(tidyverse)
library(palmerpenguins)
theme_set(theme_bw(16))
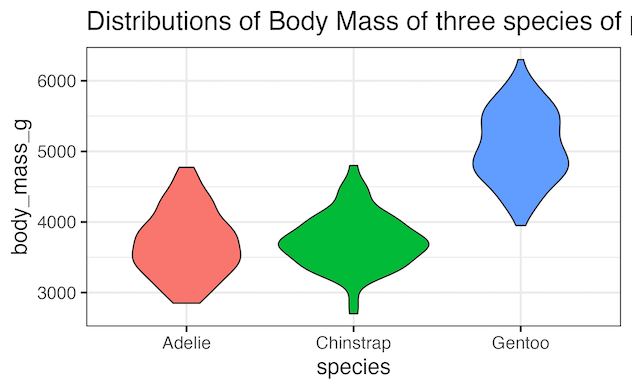
A violin plot with a long title text
Let us make a violin plot using Palmer penguins dataset with a long title that does not fit in a single line.
penguins %>%
  ggplot(aes(x=species, y= body_mass_g, fill=species))+
  geom_violin()+
  theme(legend.position="none")+
  labs(title = "Distributions of Body Mass of three species of penguins from Palmer Penguin Data")
ggsave("ggplot2_with_long_title.png")
We can see that the long title get cuts off the plot.

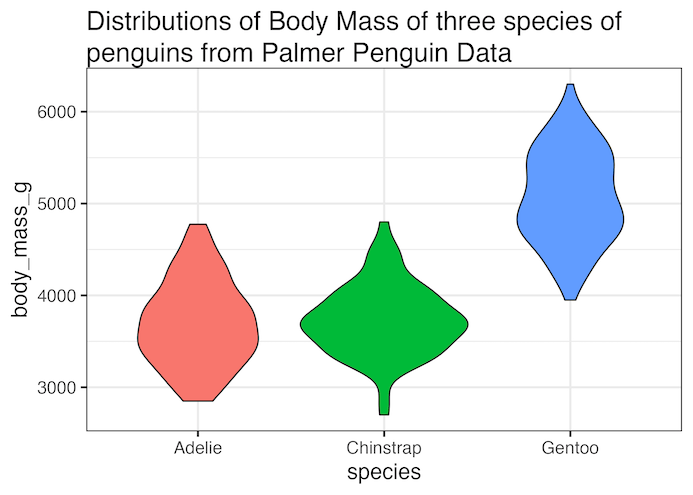
Method 1: Wrap ggplot2 Title with a New Line Character (\n)
One of the solutions to wrap a long title is to use new line character “\n” at the right place and break the title into two lines. Note the “\n” symbol within title text.
penguins %>%
  ggplot(aes(x=species, y= body_mass_g, fill=species))+
  geom_violin()+
  theme(legend.position="none")+
  labs(title = "Distributions of Body Mass of three species\nof penguins from Palmer Penguin Data")
ggsave("ggplot2_folding_long_title_with_newline_character.png")
And here is how it looks after breaking the long title into two lines.

Method 2: Break Long ggplot2 Title into Title and Subtitle
Another hack to deal with a long title is to manually split into two lines, then using the first line with title argument to labs() and the second line with subtitle argument to labs().
penguins %>%
  ggplot(aes(x=species, y= body_mass_g, fill=species))+
  geom_violin()+
  theme(legend.position="none")+
  labs(title = "Distributions of Body Mass of three species",
  subtitle="of penguins from Palmer Penguin Data")
ggsave("ggplot2_folding_long_title_using_subtitle.png")
This is not fully satisfactory, as the size of subtitle text will be smaller than the title text. And also we need to manually break the long text.

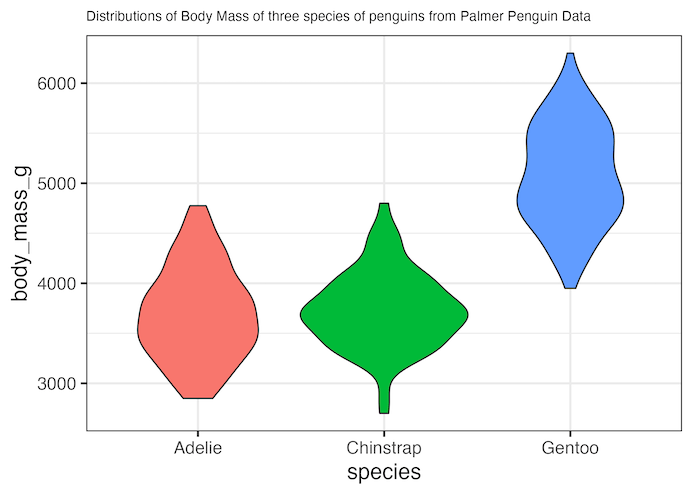
Method 3: Reduce ggplot2 Title Size with element_text()
A crude solution that might work sometimes is to reduce the title text’s size. Here we use element_text() function to reduce the size. Note that this approach tries to fit the text in a single line instead of wrapping it into multiple lines.
penguins %>%
  ggplot(aes(x=species, y= body_mass_g, fill=species))+
  geom_violin()+
  labs(title = "Distributions of Body Mass of three species of penguins from Palmer Penguin Data")+
  theme(legend.position="none",
        plot.title = element_text(size = 10))
ggsave("ggplot2_reduce_size_of_long_title_to_fit.png")
Method 4: Automatically Wrap ggplot2 Title with stringr::str_wrap()
One of the better solutions to wrap a long title text is to use stringr’s str_wrap() function and fold the text by specifying the width we would like.
Here is an example of using str_wrap() function to wrap a long title text.
penguins %>%
  ggplot(aes(x=species, y= body_mass_g, fill=species))+
  geom_violin()+
  labs(title = stringr::str_wrap("Distributions of Body Mass of three species of penguins from Palmer Penguin Data", width=50)) +
  theme(legend.position="none")
ggsave("ggplot2_wrap_long_title_with_stringr_str_wrap.png")

Method 5: Wrap ggplot2 Title with ggtext::element_textbox_simple()
Another better solution is to use the element_textbox_simple() function in ggtext package. element_textbox_simple() in ggtext package is versatile with multiple options, here we use it to just wrap the title text automatically into multiple lines.
library(ggtext)
penguins %>%
  ggplot(aes(x=species, y= body_mass_g, fill=species))+
  geom_violin()+
  theme(legend.position="none")+
  labs(title = "Distributions of Body Mass of three species of penguins from Palmer Penguin Data")+
  theme(plot.title = element_textbox_simple())
ggsave("ggplot2_wrap_long_title_with_ggtext_element_textbox_simple.png")
Comparison of Methods to Wrap Long Titles in ggplot2
| Method | Example Code | Pros | Cons |
|---|---|---|---|
New Line Character (\n) |
labs(title="line1\nline2") |
Simple, no extra packages | Manual placement; needs editing if title changes |
| Title + Subtitle | labs(title="line1", subtitle="line2") |
Built-in solution; no extra packages | Subtitle smaller text; not true wrapping |
| Reduce Title Size | theme(plot.title=element_text(size=10)) |
Quick way to fit text in one line | Doesn’t wrap; harder to read small titles |
stringr::str_wrap() |
labs(title=str_wrap("text", width=50)) |
Automatic wrapping by width; flexible | Needs stringr package |
ggtext::element_textbox_simple() |
theme(plot.title=element_textbox_simple()) |
Advanced formatting; automatic wrapping | Requires ggtext package |
Best Way to Wrap Long Titles in ggplot2
The easiest quick fix is to use a newline character (\n), while
stringr::str_wrap() and ggtext::element_textbox_simple()
offer more flexibility for automatic wrapping and publication-ready results.
Choose the method that matches your use case.
For more tips, see our complete ggplot2 guide.
Frequently Asked Questions (FAQs)
How do I wrap long axis labels in ggplot2?
To wrap long axis labels, you can use stringr::str_wrap() inside
scale_x_discrete() or scale_y_discrete().
For example:
scale_x_discrete(labels = function(x) stringr::str_wrap(x,
                                                        width = 10))
This will automatically break long labels into multiple lines, improving readability on crowded plots.
Can facet labels in ggplot2 be wrapped into multiple lines?
Yes. Facet labels can also be wrapped using labeller() combined with
stringr::str_wrap(). Example:
facet_wrap(~ variable,
             labeller = labeller(variable = function(x)
                                  stringr::str_wrap(x, width = 20)))
This ensures facet titles don’t overflow when using descriptive variable names.
What is the best way to handle long legends in ggplot2?
If legend text is long, you can use guides() with label_wrap_gen() from
scales package:
guides(fill = guide_legend(label.hjust = 0,
                           label.theme = element_text(size = 10),
                           label.wrap = scales::label_wrap_gen(width = 15)))
This wraps legend labels across multiple lines while keeping the legend neat.
How do I wrap ggplot2 captions or footnotes?
Captions can be wrapped using the same str_wrap() approach in
labs(caption = ...). If you want richer text formatting (bold, italics, links),
use the ggtext package with element_textbox_simple() for
plot.caption.
Explore the Complete ggplot2 Guide
35+ tutorials with code: scatterplots, boxplots, themes, annotations, facets, and more—tested and beginner-friendly.
Visit the ggplot2 Hub → No fluff—just code and visuals.


