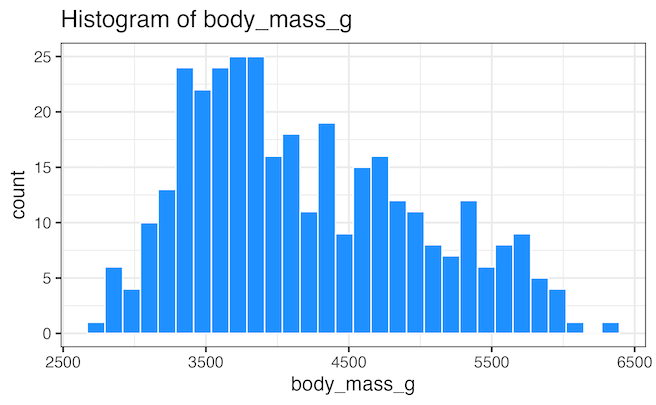
In this tutorial, we will learn how to write a function to make a histograms using ggplot2 in R. Writing a function to create plots is useful, when you make a lot of plots, in this example, a lot of histograms. Thanks to the upcoming 2nd edition of R for Data Science by Hadley Wickham,… Continue reading How to write a function make histograms with ggplot
