
Legends in ggplot2 are powerful but can sometimes clutter your visualization. In this tutorial using ggplot2 in R, we’ll walk step by step through methods to hide all legends, remove specific ones like color or shape, control them at the layer level, and even tidy them with scale functions.
Along the way, we’ll highlight common mistakes, best practices, and show how to make publication-ready plots using the Palmer Penguins dataset.
When (and why) remove legends?
Legends are essential when viewers need to decode mappings, but not every plot benefits from them. In small multiples or annotated plots, legends often repeat information and consume precious space.
Removing legends can help declutter the graphic, emphasize the data, and create cleaner layouts. However, be cautious—removing too much can make a plot ambiguous.
A good rule of thumb: keep at least one legend for orientation and only hide what isn’t useful for interpretation.
Setup & Data (Palmer Penguins)
We’ll use palmerpenguins and set a consistent theme for clean output. The palmerpenguins dataset is a real-world data to start off as it ontains real-world biological measurements of penguins across species, islands, and sexes.
We’ll use a random subset of rows to keep our plots simple and readable when jittering points.
Our example dataset is perfect for showing legends, because species, sex, and body mass are categorical and continuous variables that naturally generate multiple legends in ggplot2.
library(tidyverse)
library(palmerpenguins)

set.seed(1)
theme_set(theme_bw(base_size = 16))

df <- penguins |>
  drop_na() |>
  sample_n(50)
Base Plot with Multiple Legends
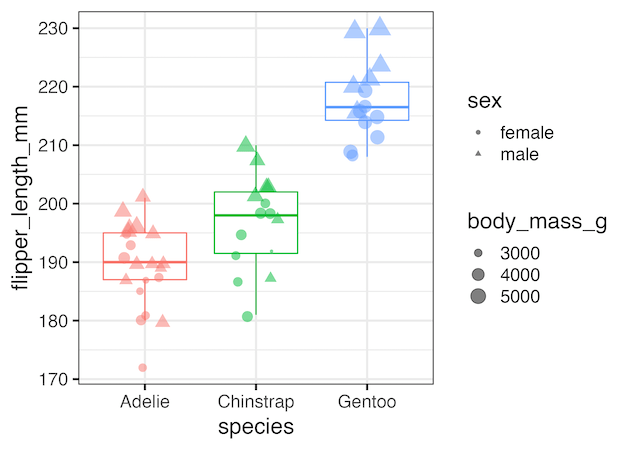
To demonstrate legend removal, let’s first create a plot with several legends. We’ll map species to color, sex to shape, and body mass to size. This generates three separate legends by default. While informative, it can also overwhelm readers and reduce focus on the main relationship: species vs. flipper length.
The baseline plot sets the stage for trying different strategies to remove, hide, or refine legends in ggplot2.
p_base <- df |>
  ggplot(aes(x = species,
             y = flipper_length_mm,
             color = species)) +
  geom_boxplot(outlier.shape = NA) +
  geom_jitter(aes(shape = sex,
                  size = body_mass_g),
                  width = 0.12,
                  alpha = 0.5) +
  labs(
    x = "Species",
    y = "Flipper length (mm)",
    color = "Species",
    shape = "Sex",
    size = "Body mass (g)",
    title = "Penguin flipper length by species with individual points"
  )

p_base
ggsave("boxplot_with_multiple_legends.png", p_base, width = 7, height = 5, dpi = 300)


Remove all legends with theme(legend.position = ‘none’)
The bluntest way to remove legends in ggplot2 is using theme(legend.position = “none”). This suppresses every legend in the plot, regardless of aesthetic.
It’s perfect for situations where legends don’t add value—such as when facet labels or annotations already explain the encodings.
However, this approach removes all orientation cues, so use it carefully. In professional reports, you’ll often pair this with direct labeling of lines or bars instead of legends.
p_all_off <- p_base + theme(legend.position = "none")
p_all_off
ggsave("remove_all_legends_with_theme.png", p_all_off, width = 7, height = 5, dpi = 300)

Remove legends with guides()
What if you only want to hide certain legends while keeping others? That’s where guides() comes in. Each aesthetic—color, fill, shape, size—can be turned off selectively by passing “none”.
For example, guides(color = “none”) hides the color legend, while guides(shape = “none”) removes the shape legend. This method is flexible and useful when you want to retain the most relevant legend but remove redundant ones.
It’s one of the most practical approaches for publication-ready figures.
# Remove only the color legend
p_no_color <- p_base +
     guides(color = "none")

# Remove only the shape legend
p_no_shape <- p_base +
     guides(shape = "none")

# Remove only the size legend
p_no_size  <- p_base +
    guides(size  = "none")

# Remove two legends at once
p_no_color_size <- p_base +
      guides(color = "none", size = "none")

Remove legend for one layer with show.legend = FALSE
Sometimes you don’t want to remove an entire legend but only stop one layer from contributing to it. That’s where show.legend comes in.
By setting show.legend = FALSE within a geom, you can prevent its mappings from appearing in the legend. This is helpful when, for example, you want the boxplot to define the color legend but don’t want the jitter points to clutter it further. This fine-grained control is very useful in multi-layer plots.
p_layer_control <- df |>
  ggplot(df, aes(species,
                 flipper_length_mm,
                 color = species)) +
  geom_boxplot(outlier.shape = NA,
               show.legend = TRUE) +
  geom_jitter(aes(shape = sex,
                  size = body_mass_g),
                  width = 0.12,
                  alpha = 0.5,
                  show.legend = FALSE) +
  labs(color = "Species",
       title = "Keep boxplot legend, hide point legend")

p_layer_control

Hide Legends via scale_*() (and tidy labels)
The scale_*() functions in ggplot2 not only control color palettes and breaks, they also let you manage legends. By adding guide = “none” to a scale, you can suppress its legend.
This is particularly useful if you’re already customizing that scale’s labels, limits, or ranges.
For example, you may set a Brewer palette for color and at the same time hide the color legend. This dual role makes scale_*() very powerful for fine-tuned control.
p_scale_hide <- p_base +
  scale_color_brewer(palette = "Dark2",
                     guide = "none") +  # hide color legend here
  scale_size_continuous(range = c(1.5, 4),
                        name = "Body mass (g)") +
  scale_shape_discrete(name = "Sex")

p_scale_hide

Keep one legend, drop the rest
In practice, you’ll often want to keep one legend and remove others. For example, in a scientific plot you may only want the color legend for species while hiding legends for shape and size.
This is easily achieved by combining per-layer show.legend = FALSE with guides() on unwanted aesthetics. The result is a cleaner plot that retains the most important information without distracting viewers with extra keys. This selective approach is the most publication-friendly.
p_keep_color_only <-
  df |>
  ggplot(aes(species,
             flipper_length_mm,
             color = species)) +
  geom_boxplot(outlier.shape = NA) +
  geom_jitter(aes(shape = sex, size = body_mass_g),
              width = 0.12,
              alpha = 0.5,
              show.legend = FALSE) +
  guides(shape = "none",
         size = "none") +
  labs(color = "Species",
       title = "Keep color legend only")

p_keep_color_only

Cleaner legend keys with override.aes
Even when legends are correct, their appearance may not be helpful. For instance, if points in your plot are tiny and semi-transparent, the legend keys will also look faint. This can confuse readers.
To fix this, use override.aes inside guide_legend(). It allows you to set aesthetics like size and alpha differently in the legend, making keys larger or clearer. This trick is invaluable for preparing publication-ready plots where clarity is paramount.
p_override <- p_base +
  guides(
    color = guide_legend(override.aes = list(alpha = 1, size = 3)),
    shape = guide_legend(override.aes = list(alpha = 1, size = 3)),
    size  = guide_legend(override.aes = list(alpha = 0.9))
  ) +
  labs(title = "Cleaner legend keys with override.aes")

p_override

Common pitfalls & fixes
Beginners often run into confusing legend behavior in ggplot2. One common mistake is mapping a constant inside aes(), which unnecessarily creates a legend entry. Another issue is duplicated legends when multiple layers map the same aesthetic.
You may also find legends reappearing after you hide them because another layer or scale reintroduces them.
Finally, legends can sometimes look too small or faint due to alpha blending. Each of these problems has fixes using show.legend, guides(), or override.aes.
Frequently Asked Questions (FAQs)
-
Why should I remove legends in ggplot2 at all?
Legends can clutter a figure when encodings are obvious (e.g., via facets or annotations). Remove them to focus attention, but keep at least one cue if interpretation might suffer. -
What is the difference between hiding a legend and customizing it?
Hiding removes it entirely; customizing simplifies or clarifies it (e.g., cleaner labels, merged categories, clearer keys) while preserving meaning. -
Why do duplicate legends appear?
Multiple layers mapping the same aesthetic can each generate a legend entry. Keep a single authoritative legend and suppress duplicates on other layers. -
Why does a legend reappear after I removed it?
Another layer or scale can regenerate it. Suppress it consistently wherever it’s introduced to prevent reappearance. -
Can I have one legend for multiple aesthetics?
Yes, by mapping the same variable consistently and configuring guides so the viewer perceives one integrated explanation. -
How do I make legends publication-friendly?
Prioritize clarity: concise labels, readable keys, logical order, and sufficient contrast. Only remove a legend if the figure remains unambiguous.
Explore the Complete ggplot2 Guide
35+ tutorials with code: scatterplots, boxplots, themes, annotations, facets, and more—tested and beginner-friendly.
Visit the ggplot2 Hub → No fluff—just code and visuals.


Hi there.
I have a question regarding the post “How to Connect Data Points on Boxplot with Lines?”, June 8, 2020. This post had no room for comments.
By creating the pipeline for the dataframe with the “paired” column, my rows were paired randomly, instead to the values of the column I chose.
I simply switched the variable names to mine, ID number = country, and my own x and y, respectively, year and lifeExp.
What can I do to pair my rows according to the ID number?
Thank you in advance,
Joel Laia
May be I have not fully understood the question. I think you can use groupby on ID and create group numbers using one of the context dependent expression for creating paired data https://dplyr.tidyverse.org/reference/context.html