

This tutorial shows you how to add p-value to each facet in ggplot2 when creating multi-panel plots in R. Using a scatter plot example, we’ll perform linear regression analysis for each facet to determine statistical significance. And then we will display the corresponding p-values directly on the plot. You’ll learn how to annotate each facet… Continue reading How to add P-value to each facet in ggplot2
Author: datavizpyr
How to make Annotated heatmap with Seaborn in Python

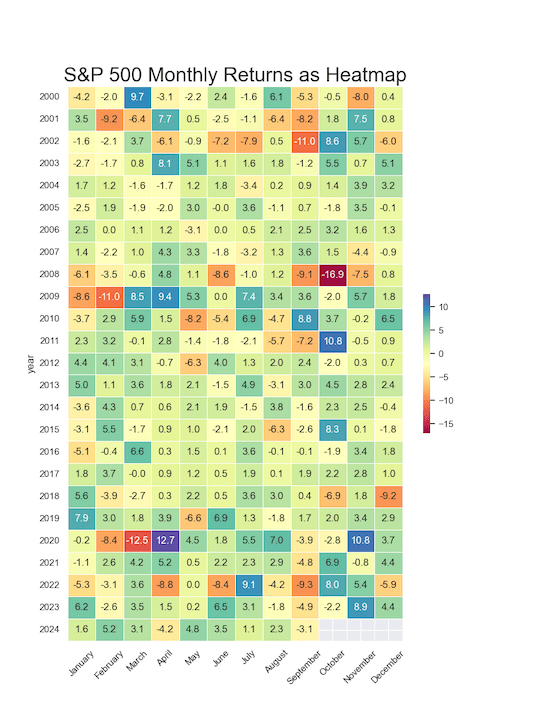
In this tutorial, you’ll learn how to create an annotated heatmap in Python using Seaborn, a powerful data visualization library built on Matplotlib. We’ll start by generating a basic heatmap with the heatmap() function to visualize data in a color-coded grid. Then, we’ll take it a step further by adding annotations—first as plain text values… Continue reading How to make Annotated heatmap with Seaborn in Python
How to Annotate Positive and Negative Values in a barplot


In this post, we will learn how to properly annotate a bars barplot, where there are both positive and negative values/bars in ggplot2. In ggplot2, we can use gem_text() with label option to annotate text or bar heights on a barplot easily. However, when we have a barplot that has both positive and negative bars,… Continue reading How to Annotate Positive and Negative Values in a barplot
How to Annotate a plot with P-value in ggplot2

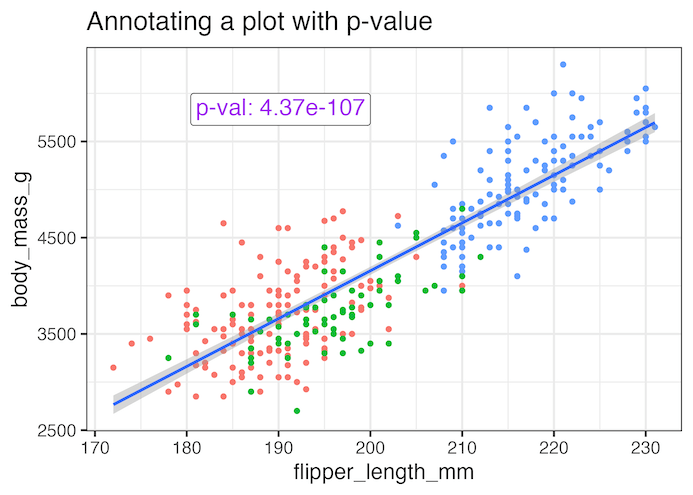
Adding statistical significance indicators to your data visualizations is crucial for communicating research findings effectively. When working with ggplot2 in R, displaying p-values directly on scatter plots helps viewers immediately understand the statistical relationship between variables. In this comprehensive tutorial, you’ll learn how to annotate ggplot2 plots with p-values from linear regression analysis. We’ll cover… Continue reading How to Annotate a plot with P-value in ggplot2
How to order facet variable in grouped boxplot by mean difference between groups in ggplot2
In this tutorial, we’ll dive into grouped boxplots using ggplot2 in R and demonstrate how to reorder facet variables based on the mean difference between groups. Imagine comparing sales performance across multiple regions or test scores across different schools—by reordering facets, you can immediately highlight which groups stand out. We’ll walk you through calculating mean… Continue reading How to order facet variable in grouped boxplot by mean difference between groups in ggplot2