
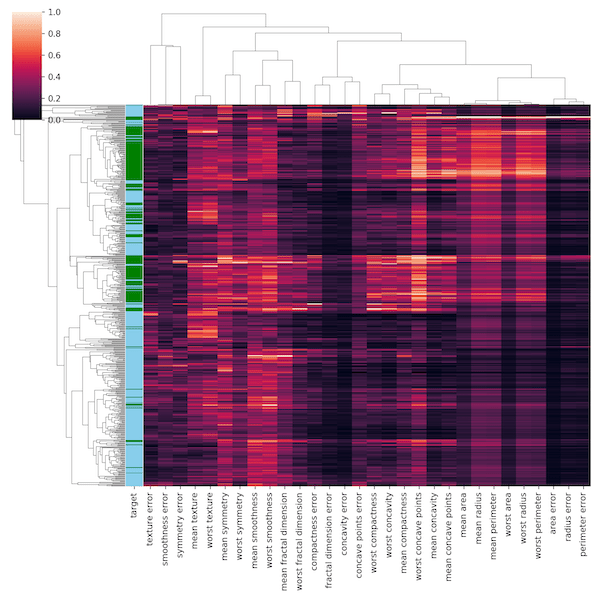
In this post, we will learn how to make hierarchically clustered heatmap in Python. We will use Saeborn’s Clustermap function to make a heat map with hierarchical clusters. Seaborn’s Clustermap is very versatile function, but we will showcase the use of the function with just one example. Let us load Pandas, Seaborn and matplotlib.pyplot to… Continue reading Hierarchically-clustered Heatmap in Python with Seaborn Clustermap
Tag: Seaborn
How To Make Ridgeline plot in Python with Seaborn?

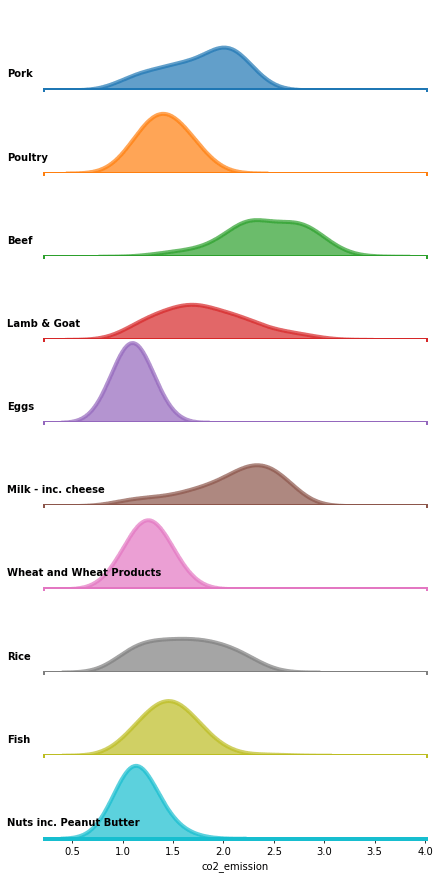
Ridgeline plots are great to visualize numerical distributions corresponding to multiple groups or categorical variables. Ridgeline plots make density plots or histograms for each group one on top of each other and thus making it look like “a mountain range”. They are great for visualizing changes in numerical distributions over time or space. Claus Wilke… Continue reading How To Make Ridgeline plot in Python with Seaborn?
How To Make Grouped Boxplot with Seaborn Catplot?

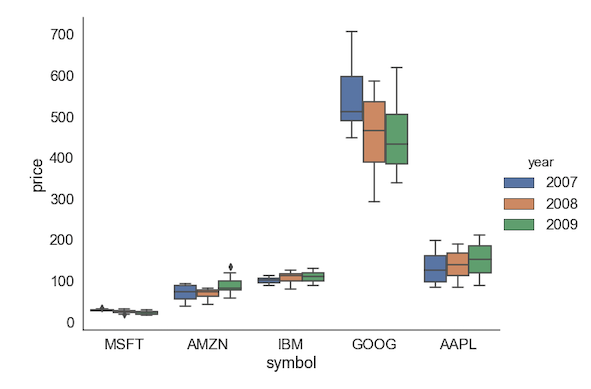
When you have a multiple groups and subgroups within each groups with associated numerical values, we can use Grouped boxplots to visualize. With Seaborn we can make grouped boxplots using boxplot() function and much newer function Catplot(). Seaborn Catplot is a function that unifies multiple data visualization techniques, including boxplots, when you have a numerical… Continue reading How To Make Grouped Boxplot with Seaborn Catplot?
How To Manually Order Boxplot in Seaborn?

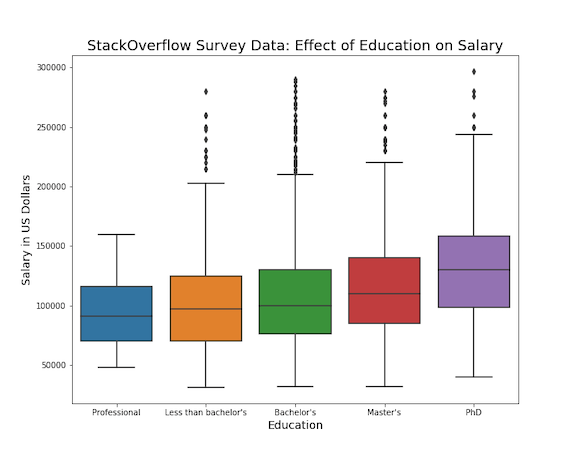
In this post we will learn how to manually sort boxes in boxplot when using Seaborn’s boxplot function in Python. Earlier we saw how to order a boxplot in Python by another variable, for example we ordered boxplot by mean/median using Seaborn. Sometimes, you may already know what order the boxes should be and want… Continue reading How To Manually Order Boxplot in Seaborn?
How to Make Horizontal Violin Plot with Seaborn in Python?

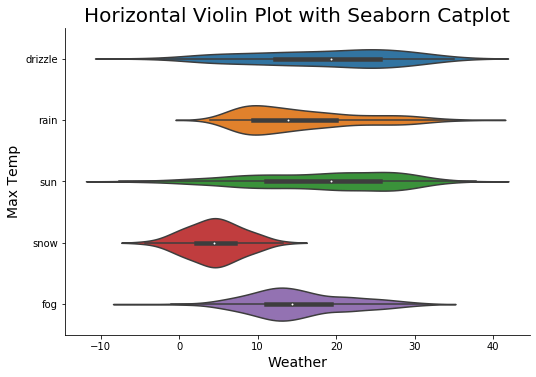
In this tutorial, we will learn how to make horizontal violin plot in Seaborn with Python. With Seaborn, we can use two similar functions, catplot() and violinplot() to make violin plots. Making a violinplot horizontal with Seaborn is pretty simple. All we need to do is specify the categorical variable on y-axis and the numerical… Continue reading How to Make Horizontal Violin Plot with Seaborn in Python?