

Grouped boxplots help us visualize the relationship between three variables, two categorical variables and one quantitative variable. When we make a boxplot, it is always a good idea to add the original data points on top of the boxplot, when possible. In this post, we will learn how to make grouped boxplots with jittered data… Continue reading Grouped Boxplot with Jittered Points with Seaborn Python
Category: Seaborn Boxplot
How To Make Grouped Boxplot with Seaborn Catplot?

When you have a multiple groups and subgroups within each groups with associated numerical values, we can use Grouped boxplots to visualize. With Seaborn we can make grouped boxplots using boxplot() function and much newer function Catplot(). Seaborn Catplot is a function that unifies multiple data visualization techniques, including boxplots, when you have a numerical… Continue reading How To Make Grouped Boxplot with Seaborn Catplot?
How To Manually Order Boxplot in Seaborn?

In this post we will learn how to manually sort boxes in boxplot when using Seaborn’s boxplot function in Python. Earlier we saw how to order a boxplot in Python by another variable, for example we ordered boxplot by mean/median using Seaborn. Sometimes, you may already know what order the boxes should be and want… Continue reading How To Manually Order Boxplot in Seaborn?
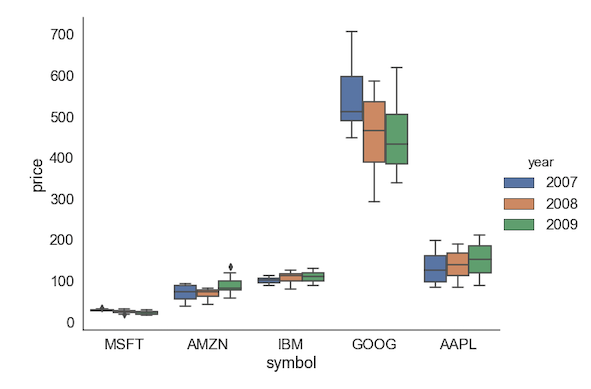
Grouped Boxplots in Python with Seaborn


In this post, we will learn how to make grouped boxplots in Python using Seaborn’s boxplot function. Grouped boxplots are a great way to visualize when you have three variables, where one of them is a numerical variable and the other two are categorical variables. Let us load the packages needed to make grouped boxplot… Continue reading Grouped Boxplots in Python with Seaborn
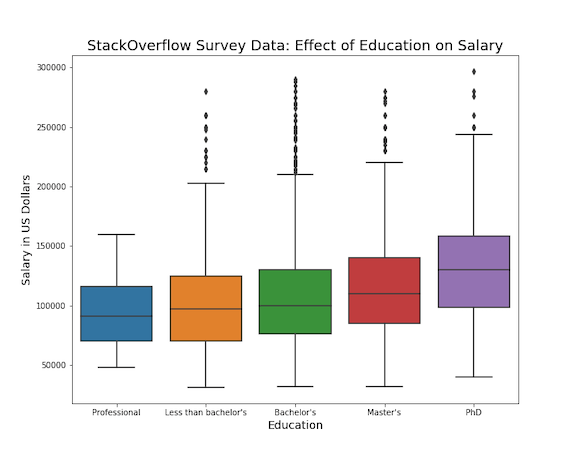
Sort Boxplot by Mean with Seaborn in Python


Sorting a boxplot by mean or median values of each group is more helpful, when you are making a boxplot with multiple groups. In this post we will see an example of starting with a boxplot that is unordered and we will use Pandas and Seaborn to sort the boxplot by mean (and median). First,… Continue reading Sort Boxplot by Mean with Seaborn in Python