
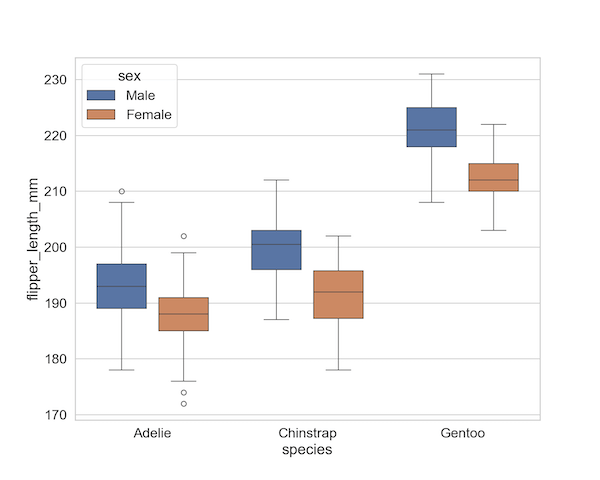
In this post we will learn how to increase the gap between boxes in a nested or grouped boxplot made with Seaborn in Python. We will use Seaborn v0.13.0 that came out in September 2023’s feature to increase the gap size. Let us first load the modules/packages needed to make boxplot and change the gap… Continue reading How to increase the gap between boxes in a grouped boxplot with Seaborn
Tag: Seaborn Boxplot
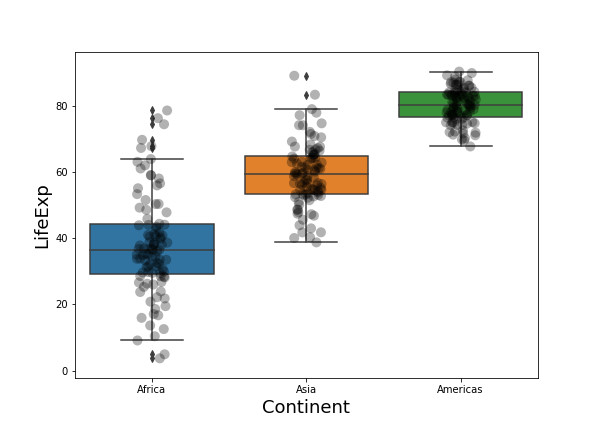
Grouped Boxplot with Jittered Points with Seaborn Python


Grouped boxplots help us visualize the relationship between three variables, two categorical variables and one quantitative variable. When we make a boxplot, it is always a good idea to add the original data points on top of the boxplot, when possible. In this post, we will learn how to make grouped boxplots with jittered data… Continue reading Grouped Boxplot with Jittered Points with Seaborn Python
How to Make Boxplots with Data Points using Seaborn in Python

Boxplot with data points on top of it is often better visualization technique than the boxplots alone. This is mainly because, boxplot with data points actually shows the data underlying the boxplots, while the boxplot alone just shows the summary statistics. Always remember, Anscombe’s quartet, while using only summary statitics. In this tutorial, we will… Continue reading How to Make Boxplots with Data Points using Seaborn in Python