
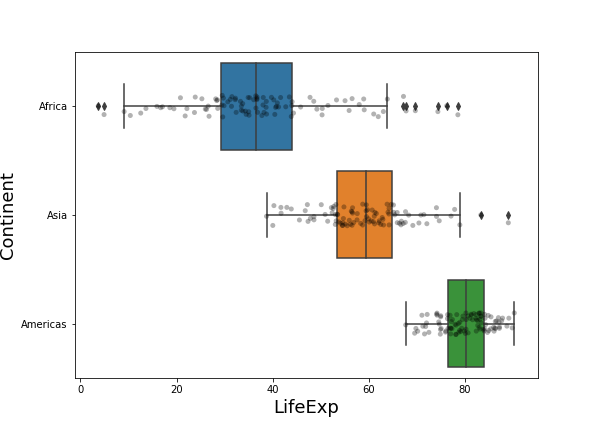
Horizontal boxplots are useful when you have lots of groups with longer names. If you make simple boxplots, the longer names would overlap on each other and make it impossible to read the group names. Horizontal boxplots solve that problem easily. In this post, we will see an example of making horizontal boxplots with data… Continue reading Horizontal Boxplots with Points using Seaborn in Python
Category: Boxplot with points Seaborn
How to Make Boxplots with Data Points using Seaborn in Python
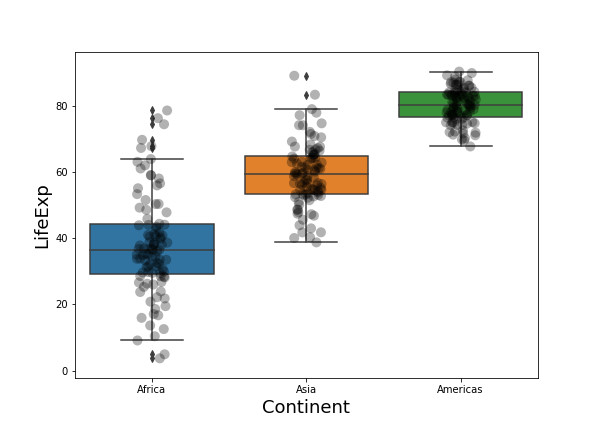
Boxplot with data points on top of it is often better visualization technique than the boxplots alone. This is mainly because, boxplot with data points actually shows the data underlying the boxplots, while the boxplot alone just shows the summary statistics. Always remember, Anscombe’s quartet, while using only summary statitics. In this tutorial, we will… Continue reading How to Make Boxplots with Data Points using Seaborn in Python