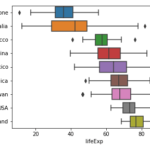
Horizontal boxplots are useful when you have lots of groups with longer names. If you make simple boxplots, the longer names would overlap on each other and make it impossible to read the group names.
Horizontal boxplots solve that problem easily.
In this post, we will see an example of making horizontal boxplots with data points overlayed on boxes.
Let us first load the libraries needed.
import seaborn as sns
import matplotlib.pyplot as plt
import pandas as pd
import numpy as np
Generate data for making boxplots
We will generate data with three variables/groups for our example. Here we using Numpy’s random module to generate random numbers for each column.
np.random.seed(31)
# Generating Data
df = pd.DataFrame({
    'Africa': np.random.normal(40, 15, 100),
    'Asia': np.random.normal(60, 10,100),
    'Americas': np.random.normal(80, 5, 100)
})
print(df.head())
The data we generated is in wide form. We will use Pandas’ melt function to convert the dataframe in wide form to lonf form.
data_df = df.melt(var_name = 'continent',
                  value_name = 'lifeExp')
print(data_df.head())
Simple Horizontal boxplot in Python
With Seaborn, we can easily make horizontal boxplots by simply swapping x and y -variables.
# horizontal boxplot with Seaborn Python
sns.boxplot(y = "continent",
            x = "lifeExp",
           data = data_df)
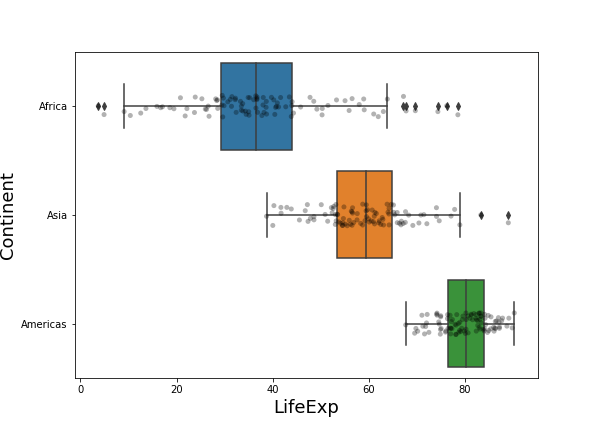
Horizontal boxplot with jittered points in Python
To make horizontal boxplots with data points, we also need to sway x and y axis for the stripplot we make using Seaborn’s stripplot() function right after Seaborn’s boxplot().
plt.figure(figsize=(8.3,6))
# horizontal boxplot  Python
sns.boxplot(y = "continent",
            x = "lifeExp",
           data = data_df)
# horizontal stripplot Python
sns.stripplot(y = "continent",
              x = "lifeExp",
              color = 'black',
              alpha=0.3,
              data=data_df)
plt.ylabel("Continent", size=18)
plt.xlabel("LifeExp", size=18)
This is how the horizontal boxplots with points overlapped would like like. In this example, we have added transparency level to data points and also set the color of data points to be black inside stripplot() function.