Sorting a boxplot by mean or median values of each group is more helpful, when you are making a boxplot with multiple groups.
In this post we will see an example of starting with a boxplot that is unordered and we will use Pandas and Seaborn to sort the boxplot by mean (and median).
First, we will see how to sort boxes in boxplot in ascending order and then we will sort the boxplot in descending order using Pandas, NumPy and Seaborn.
Let us first import all the libraries we need to use.
import seaborn as sns
import matplotlib.pyplot as plt
import pandas as pd
import numpy as np
Generate data by simulation to make boxplots
We will generate data by simulation and make a dataframe with multiple variables for boxplot. We use NumPy’s random module to generate random numbers for each variable with different mean values.
np.random.seed(42)
# Generating Data
df = pd.DataFrame({
    'Morocco': np.random.normal(57, 5,100),
    'USA': np.random.normal(73, 5, 100),
    'Jamaica': np.random.normal(68, 8,100),
    'Sierra Leone': np.random.normal(37, 10, 100),
    'Iceland': np.random.normal(76, 5, 100)
  })
Our data in the Pandas data frame look like this. You can see that the data is in wide form.
print(df.head())

   Morocco        USA    Jamaica  Sierra Leone    Iceland
0  59.483571  65.923146  70.862299     28.710050  68.027862
1  56.308678  70.896773  72.486276     31.398190  73.003125
2  60.238443  71.286427  76.664410     44.472936  76.026218
3  64.615149  68.988614  76.430416     43.103703  76.234903
4  55.829233  72.193571  56.978645     36.790984  73.749673
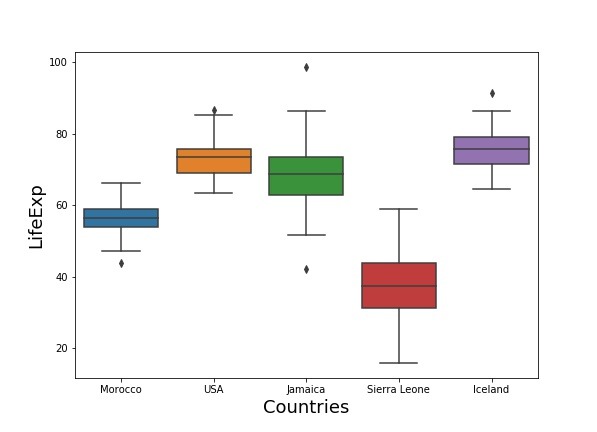
Simple Boxplot with Python
Seaborn can take the Pandas dataframe with data in wide form and make a boxplot. We just need to provide the data frame as input to Seaborn’s boxplot function.
# make boxplot with Seaborn's boxplot function
# with data in wide form
sns.boxplot(data=df)
# set x-axis label
plt.xlabel("Countries", size=18)
# set y-axis label
plt.ylabel("LifeExp", size=18)
Our simple boxplot that is unordered looks like this.

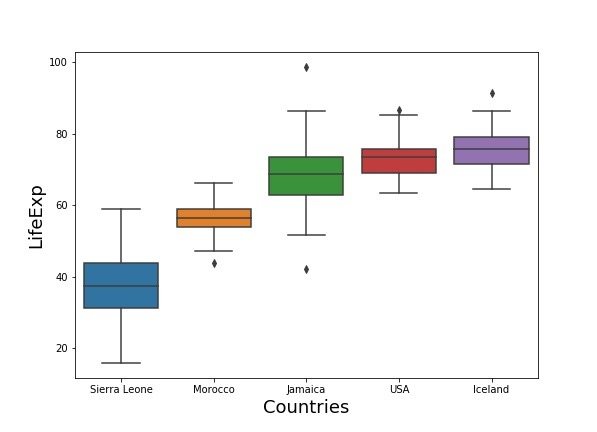
How To Sort Boxplots in Ascending Order with Python
Let us first compute mean value for each group using Pandas. We will also sort the mean values to find the indices after sorting.
# compute mean per group and find index after sorting
sorted_index = df.mean().sort_values().index
Our sorted index looks like this, in ascending order.
sorted_index

Index(['Sierra Leone', 'Morocco', 'Jamaica', 'USA', 'Iceland'], dtype='object')
We can also sort the boxplot by median value instead of mean. In this example sorted order is the same in both the cases.
# compute median per group and find index after sorting
sorted_index = df.median().sort_values().index
sorted_index
Index(['Sierra Leone', 'Morocco', 'Jamaica', 'USA', 'Iceland'], dtype='object')
We can use the sorted index to sort the Pandas dataframe. Pandas’s sort_values() function sorts in ascending order by default.
df_sorted=df[sorted_index]
	Sierra Leone	Morocco	Jamaica	USA	Iceland
0	28.710050	59.483571	70.862299	65.923146	68.027862
1	31.398190	56.308678	72.486276	70.896773	73.003125
2	44.472936	60.238443	76.664410	71.286427	76.026218
3	43.103703	64.615149	76.430416	68.988614	76.234903
4	36.790984	55.829233	56.978645	72.193571	73.749673
And now we are ready to make a sorted boxoplot with Seaborn.
# sorted boxplot with Seaborn's boxplot
sns.boxplot(data=df_sorted)
# set x and y axis labels
plt.xlabel("Countries", size=18)
plt.ylabel("LifeExp", size=18)
Now our boxplot is ordered by each group’s mean/median value. Note that the boxplots are sorted in ascending order.
How to Sort Boxplot in Descending Order with Pandas, Numpy and Seaborn?
Sometimes you might to sort a boxplot by its mean or median but in descending order. The key step to get boxplots in descending order is to get the sorted index in descending order.
We can do that by changing the default ascending=True to asending=False while using Pandas sort_values() to sort the mean or median values.
# compute mean per group and find index after sorting in descending order
sorted_index_desc = df.mean().sort_values(ascending=False).index
# We can also use existing index and
# flip the order with NumPy
#sorted_index_desc = np.flip(sorted_index)
Now that we have sorted the groups in descending order, let us use it and sort the Pandas dataframe.
df_sorted_desc=df[sorted_index_desc]
df_sorted_desc.head()
We have the dataframe in the right descending order we wanted. Now we can use Seaborn’s boxplot() function as before to make boxplot.
# make boxplots sorted in descending order with Seaborn's boxplot()
sns.boxplot(data=df_sorted_desc)
plt.xlabel("Countries", size=18)
plt.ylabel("LifeExp", size=18)
Our boxplot is sorted by mean in desending order as we wanted.

To summarize, In this beginner level tutorial, we saw examples of how to sort a boxplot made with Seaborn’s function boxplot() by either its mean or median. We used NumPy, Pandas, and Seaborn to sort the boxplot both in ascending and descending order.