Boxplot is a way to visualize quantitative/numeric variable, in a concise way using quartiles of a data distribution.
Here, we will see examples of making simple boxplots using Seaborn in Python. Let us first load packages needed for making boxplot.
import seaborn as sns
import matplotlib.pyplot as plt
import pandas as pd
We will use weather data from Seattle from vega-dataset. We will directly load the data into a dataframe from vega-dataset’s github page.
weather_df = pd.read_csv("https://raw.githubusercontent.com/vega/vega-datasets/master/data/weather.csv")
Seattle weather data contains 7 variables including maximum/minimum tempearatures and type of weather event, like drizzle, rain, and snow.
weather_df.head()
  location        date  precipitation  temp_max  temp_min  wind  weather
0  Seattle  2012-01-01            0.0      12.8       5.0   4.7  drizzle
1  Seattle  2012-01-02           10.9      10.6       2.8   4.5     rain
2  Seattle  2012-01-03            0.8      11.7       7.2   2.3     rain
3  Seattle  2012-01-04           20.3      12.2       5.6   4.7     rain
4  Seattle  2012-01-05            1.3       8.9       2.8   6.1     rain
We can make boxplots using Seaborn in at least two ways.
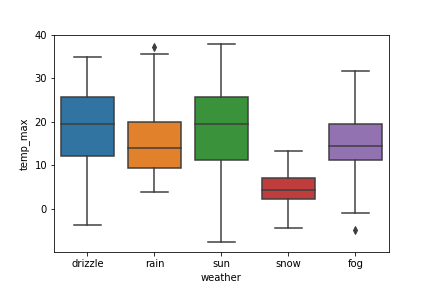
Seaborn has boxplot() function to make boxplots. The boxplot function takes the x and y-axis variables and the dataframe containing the data as arguments to make the boxplot.
sns.boxplot(x="weather",
            y="temp_max",
            data=weather_df)
Seaborn automatically colors the boxplots as well.

Boxplot in Seaborn Using Catplot
Another way make boxplot with Seaborn is to use Seaborn’s catplot function. The catplot function, short for categorical plot, can make multiple types of plots involving categorical variables including boxplots.
We can use catplot to make boxplot by specifying the argument `kind=”box”` in addition to the basic input for making boxplots.
sns.catplot(x="weather",
            y="temp_max",
            kind="box",
            data=weather_df)
The boxplot we get from Seaborn’s catplot is very similar to the boxplot that we made using Seaborn’s boxplot function.