Boxplots made with Seaborn automatically gets colors by default. Sometimes you might want to change and assign different colors to the boxes in the boxplot. For example, one might want to color boxplots with colors that are colorblind friendly.
One great solution to color the boxes in boxplot is to use many of the available color palettes from Seaborn. Note these color palettes general for any visualization with Seaborn, not just for boxplots.
In this post, we will see examples of using Seaborn’s color palettes for coloring boxplots in two ways.
Let us load the necessary packages.
import seaborn as sns
import matplotlib.pyplot as plt
import pandas as pd
import numpy as np
We will generate some data to make the boxplots.
np.random.seed(42)
# Generating Data
df = pd.DataFrame({
    'Africa': np.random.normal(40, 15, 100),
    'Asia': np.random.normal(60, 10,100),
    'Americas': np.random.normal(80, 5, 100)
})
print(df.head())
The data we generated is in wide form. Let us convert the data in wide form to long form using Pandas’ melt function.
data_df = df.melt(var_name='continent',value_name='lifeExp')
print(data_df.head())
Let us first make basic boxplot with Seaborn’s boxplot() function.
sns.boxplot(x="continent", y="lifeExp", data=data_df)
We can see that the boxes in boxplots are filled with default colors.

There are two ways to set colors for boxes in boxplot. The first way is set the Seaborn color palette we want using the palette argument inside the boxplot() function. In this example below, we specify the color palette using the argument palette=”Set1″.
sns.boxplot(x="continent", y="lifeExp", data=data_df, palette="Set1")
We see that the boxes are colored by the colors chosen by the color palette “Set1”.

Similarly we can use any of the available Seaborn color palettes as argument to palette inside the bioxplot function,
sns.boxplot(x="continent", y="lifeExp", data=data_df, palette="Set3")
Here we have used paletter=”Set3″.

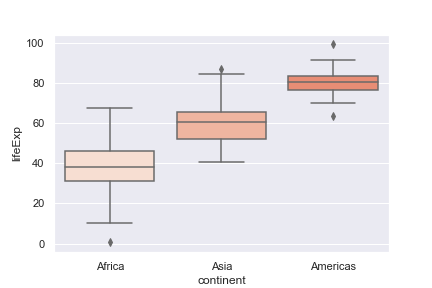
Another way to use the Seaborn color palettes and set colors for boxplot is to use the function set_palette() outside the boxplot() function. As you can see, the advantage is that the set_palette() functions allows us choose a color palette for all the plots in the session not just the boxplot.
sns.set_palette("Reds")
sns.boxplot(x="continent", y="lifeExp", data=data_df)
In this example, we have used the color palette “Reds” and set it using set_palette() function.
We can also create our own color palette. For example, we can manually select a list of colors and use them as our color palette.
my_colors = ["#9b59b6", "#3498db", "#2ecc71"]
sns.set_palette(my_colors)
sns.boxplot(x="continent", y="lifeExp", data=data_df)
Here is the boxplot using manually defining colors for color palette and using them with set_palette() function.